Technical Analysis: Trading Scenario $ZEC and Key Price Levels
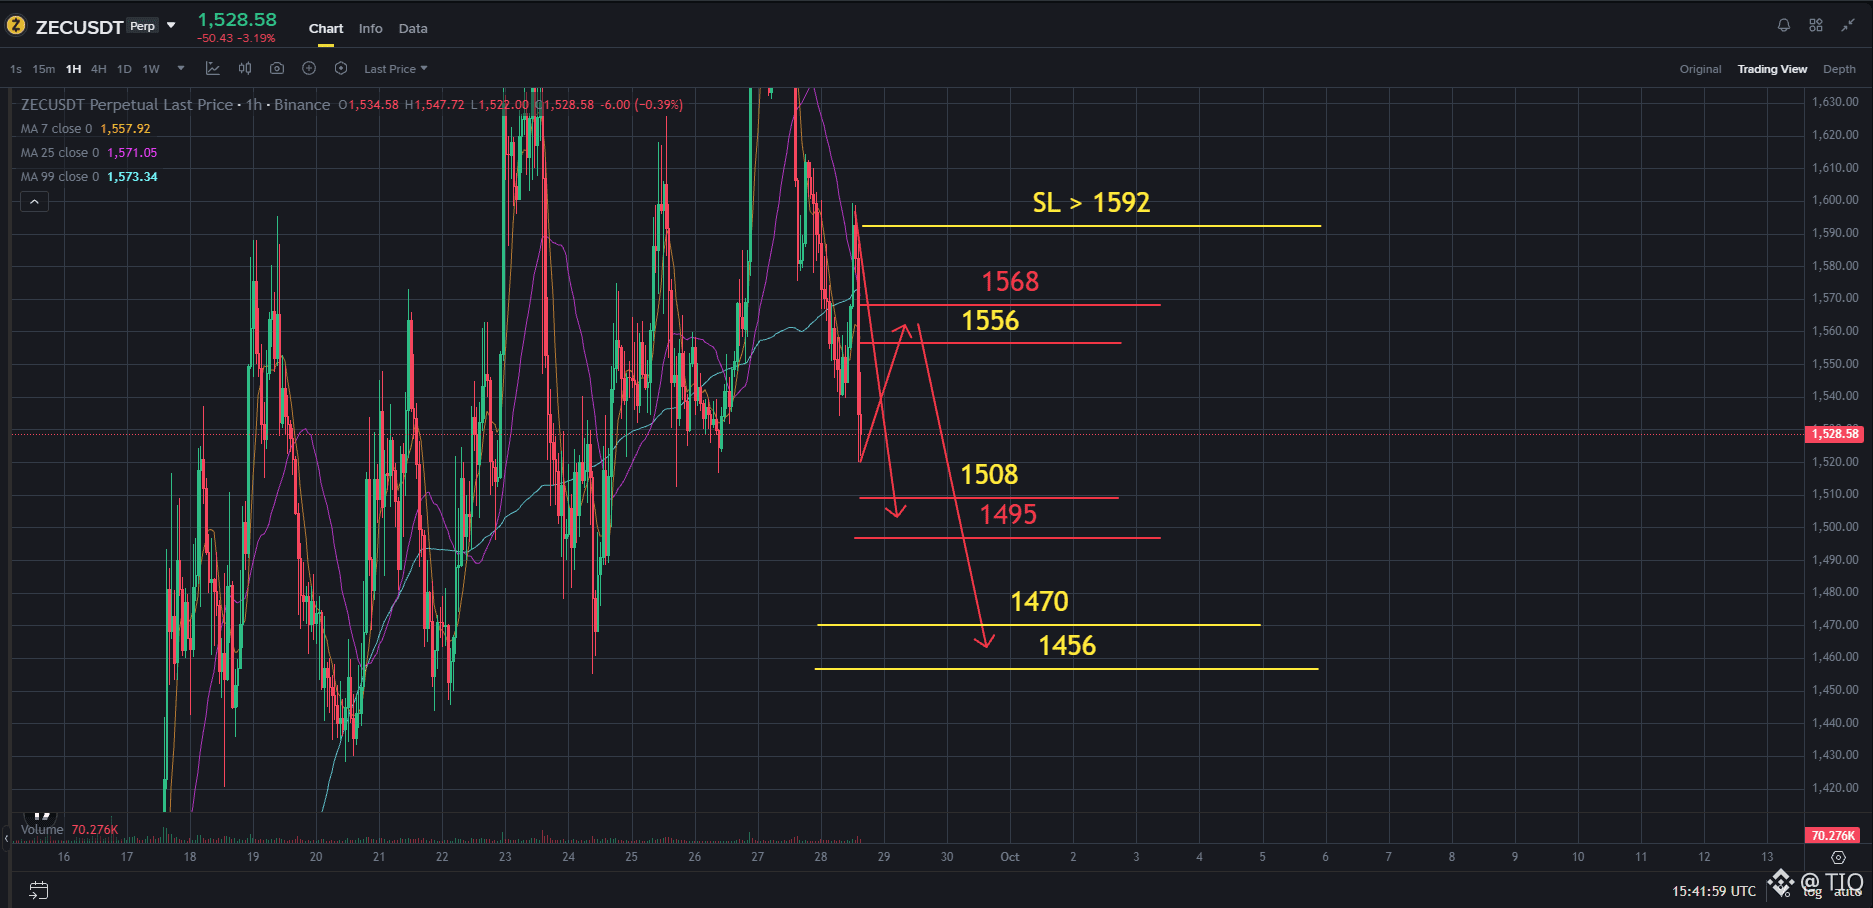
The ZEC/USDT trading pair on the 1h timeframe shows signs of entering a bearish correction phase after encountering resistance at the short-term peak. The current price is fluctuating around the 1,528.58 mark. It is expected that price will show a short-term technical rebound to test the overhead resistance zone before continuing the downtrend toward lower support levels.
Entry Short: 1556 - 1568
Stop Loss - SL: > 1592
TP1 : 1495 - 1508
TP2 : 1456 - 1470
Note: Analysis is based on technical data from the chart and is for reference only. Always maintain risk management discipline and set an appropriate Stop Loss for each trading position.
Click here to view the chart #zec 👇👇👇
The ZEC/USDT trading pair on the 1h timeframe shows signs of entering a bearish correction phase after encountering resistance at the short-term peak. The current price is fluctuating around the 1,528.58 mark. It is expected that price will show a short-term technical rebound to test the overhead resistance zone before continuing the downtrend toward lower support levels.
Entry Short: 1556 - 1568
Stop Loss - SL: > 1592
TP1 : 1495 - 1508
TP2 : 1456 - 1470
Note: Analysis is based on technical data from the chart and is for reference only. Always maintain risk management discipline and set an appropriate Stop Loss for each trading position.
Click here to view the chart #zec 👇👇👇