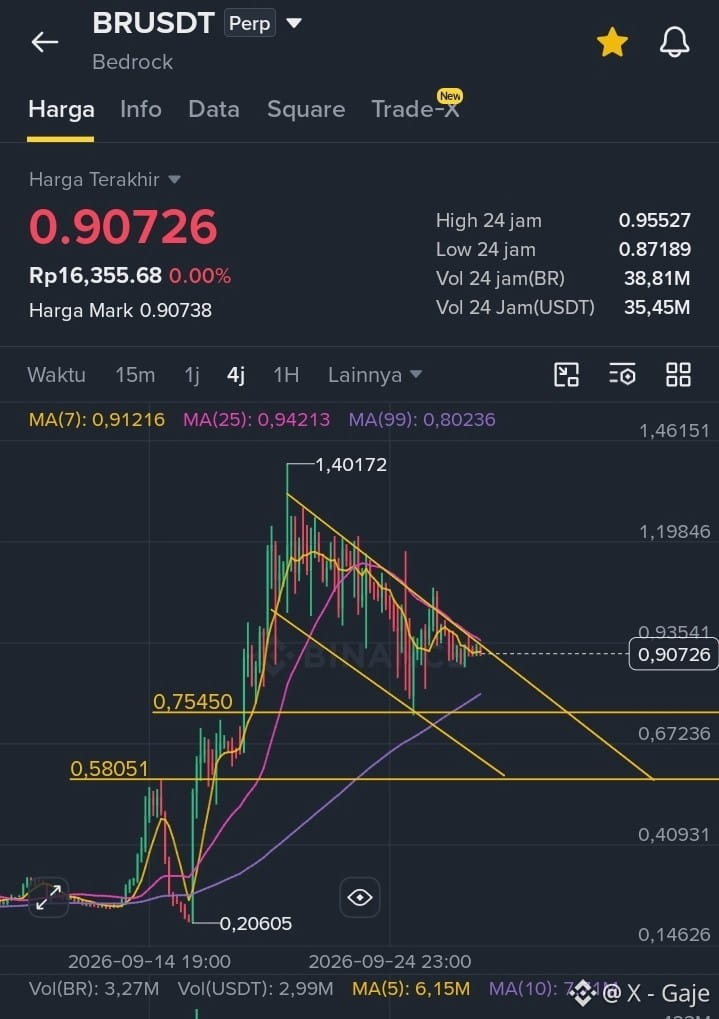
From the $BR 4H chart you sent, it is currently in a consolidation phase under bearish pressure, but there is no breakdown confirmation yet.
🔎 Key level $BR
Price: $0.907
MA7: $0.912 → price is slightly below it
MA25: $0.942 → still below, indicating short-term pressure
MA99: $0.802 → the medium-term trend is still supported by this area
Nearest support: $0.872
Next support: $0.802–0.80
Strong support: $0.7545
Resistance: $0.935–0.942
Next resistance around $1.00–1.05
The chart also shows a decline pattern from the peak at $1.4017, with consistently lower highs. So as long as it hasn’t broken the downtrend line and the MA25, any rebound still has the potential to be a pullback. The latest market data also shows BR around $0.91, with a new ATH recorded in September 2026, meaning volatility is indeed very high.
📉 Bearish scenario
If $0.872 is broken and the 4H candle closes below it, I will be watching: $0.84 → $0.802 → $0.7545
Especially at $0.802—this is important because it is close to the MA99 on your chart.
📈 Bullish scenario
If BR can rise again and the 4H close is above $0.935–0.942, bearish pressure will start to ease. Next, the $1.00 area becomes an important psychological level.
Chart takeaway: right now, I still see BR leaning more toward sideways-bearish, but the $0.907 position is already close enough to the $0.872 support that chasing shorts here carries the risk of getting a rebound. Clearer confirmation would be a break of $0.872 for bearishness or a reclaim of $0.942 for bullishness.
🔎 Key level $BR
Price: $0.907
MA7: $0.912 → price is slightly below it
MA25: $0.942 → still below, indicating short-term pressure
MA99: $0.802 → the medium-term trend is still supported by this area
Nearest support: $0.872
Next support: $0.802–0.80
Strong support: $0.7545
Resistance: $0.935–0.942
Next resistance around $1.00–1.05
The chart also shows a decline pattern from the peak at $1.4017, with consistently lower highs. So as long as it hasn’t broken the downtrend line and the MA25, any rebound still has the potential to be a pullback. The latest market data also shows BR around $0.91, with a new ATH recorded in September 2026, meaning volatility is indeed very high.
📉 Bearish scenario
If $0.872 is broken and the 4H candle closes below it, I will be watching: $0.84 → $0.802 → $0.7545
Especially at $0.802—this is important because it is close to the MA99 on your chart.
📈 Bullish scenario
If BR can rise again and the 4H close is above $0.935–0.942, bearish pressure will start to ease. Next, the $1.00 area becomes an important psychological level.
Chart takeaway: right now, I still see BR leaning more toward sideways-bearish, but the $0.907 position is already close enough to the $0.872 support that chasing shorts here carries the risk of getting a rebound. Clearer confirmation would be a break of $0.872 for bearishness or a reclaim of $0.942 for bullishness.