$QNT Quant (QNT) — Latest Analysis Today, September 28, 2026
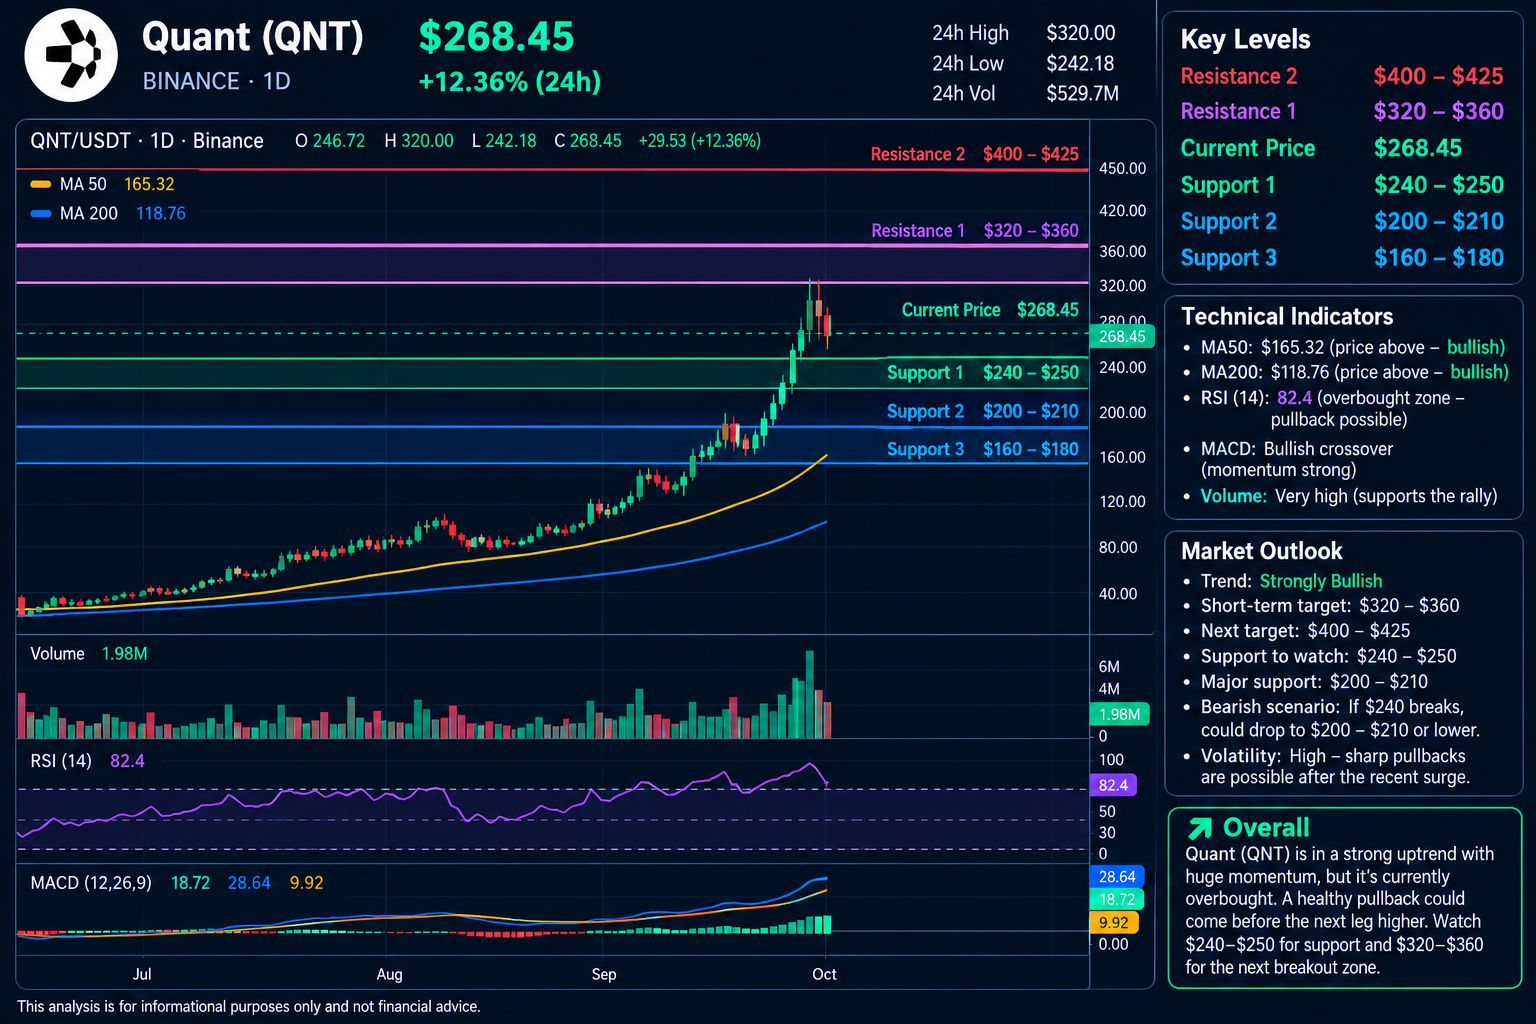
Quant is experiencing extreme volatility today. Different exchanges/data feeds are showing roughly $250–$280, after QNT surged more than 300% over the past week. One Binance historical snapshot shows today’s range around $242–$320, while another live feed reported about $250.72. �
Investing.com +1
📈 Technical picture
Short-term trend: 🟢 Strong bullish
Current zone: ~$250–$280
Major resistance: $320–$360
Major upside resistance: around $400–$425
First support: $240–$250
Important support: $200–$210
Deeper support: $160–$180
QNT's daily trend remains bullish, with price above its major moving averages, but RSI is in/near overbought territory and the huge recent rally increases the possibility of sharp profit-taking. �
Altcoin Buzz +1
🕯️ What today's candles are saying
The recent candles show very large ranges and heavy volume. QNT moved from around $65 last week to above $300 at points today, so this is not a normal low-volatility breakout. �
Investing.com Canada +1
Bullish scenario: If QNT reclaims and holds $320–$360 with strong volume, the market could test the $400+ area.
Pullback scenario: Failure to hold $240–$250 could bring a deeper correction toward $200–$210, with $160–$180 as another important area.
Key point: The trend is strongly bullish, but after a move of this magnitude, volatility and pullback risk are extremely high. Today's reports also show QNT has already pulled sharply back from intraday highs. �#ChinaMayLetAlibabaByteDanceBuyNvidiaChips #BitgetDetailsSecurityIncidentTimeline #ChinaMayLetAlibabaByteDanceBuyNvidiaChips
Quant is experiencing extreme volatility today. Different exchanges/data feeds are showing roughly $250–$280, after QNT surged more than 300% over the past week. One Binance historical snapshot shows today’s range around $242–$320, while another live feed reported about $250.72. �
Investing.com +1
📈 Technical picture
Short-term trend: 🟢 Strong bullish
Current zone: ~$250–$280
Major resistance: $320–$360
Major upside resistance: around $400–$425
First support: $240–$250
Important support: $200–$210
Deeper support: $160–$180
QNT's daily trend remains bullish, with price above its major moving averages, but RSI is in/near overbought territory and the huge recent rally increases the possibility of sharp profit-taking. �
Altcoin Buzz +1
🕯️ What today's candles are saying
The recent candles show very large ranges and heavy volume. QNT moved from around $65 last week to above $300 at points today, so this is not a normal low-volatility breakout. �
Investing.com Canada +1
Bullish scenario: If QNT reclaims and holds $320–$360 with strong volume, the market could test the $400+ area.
Pullback scenario: Failure to hold $240–$250 could bring a deeper correction toward $200–$210, with $160–$180 as another important area.
Key point: The trend is strongly bullish, but after a move of this magnitude, volatility and pullback risk are extremely high. Today's reports also show QNT has already pulled sharply back from intraday highs. �#ChinaMayLetAlibabaByteDanceBuyNvidiaChips #BitgetDetailsSecurityIncidentTimeline #ChinaMayLetAlibabaByteDanceBuyNvidiaChips