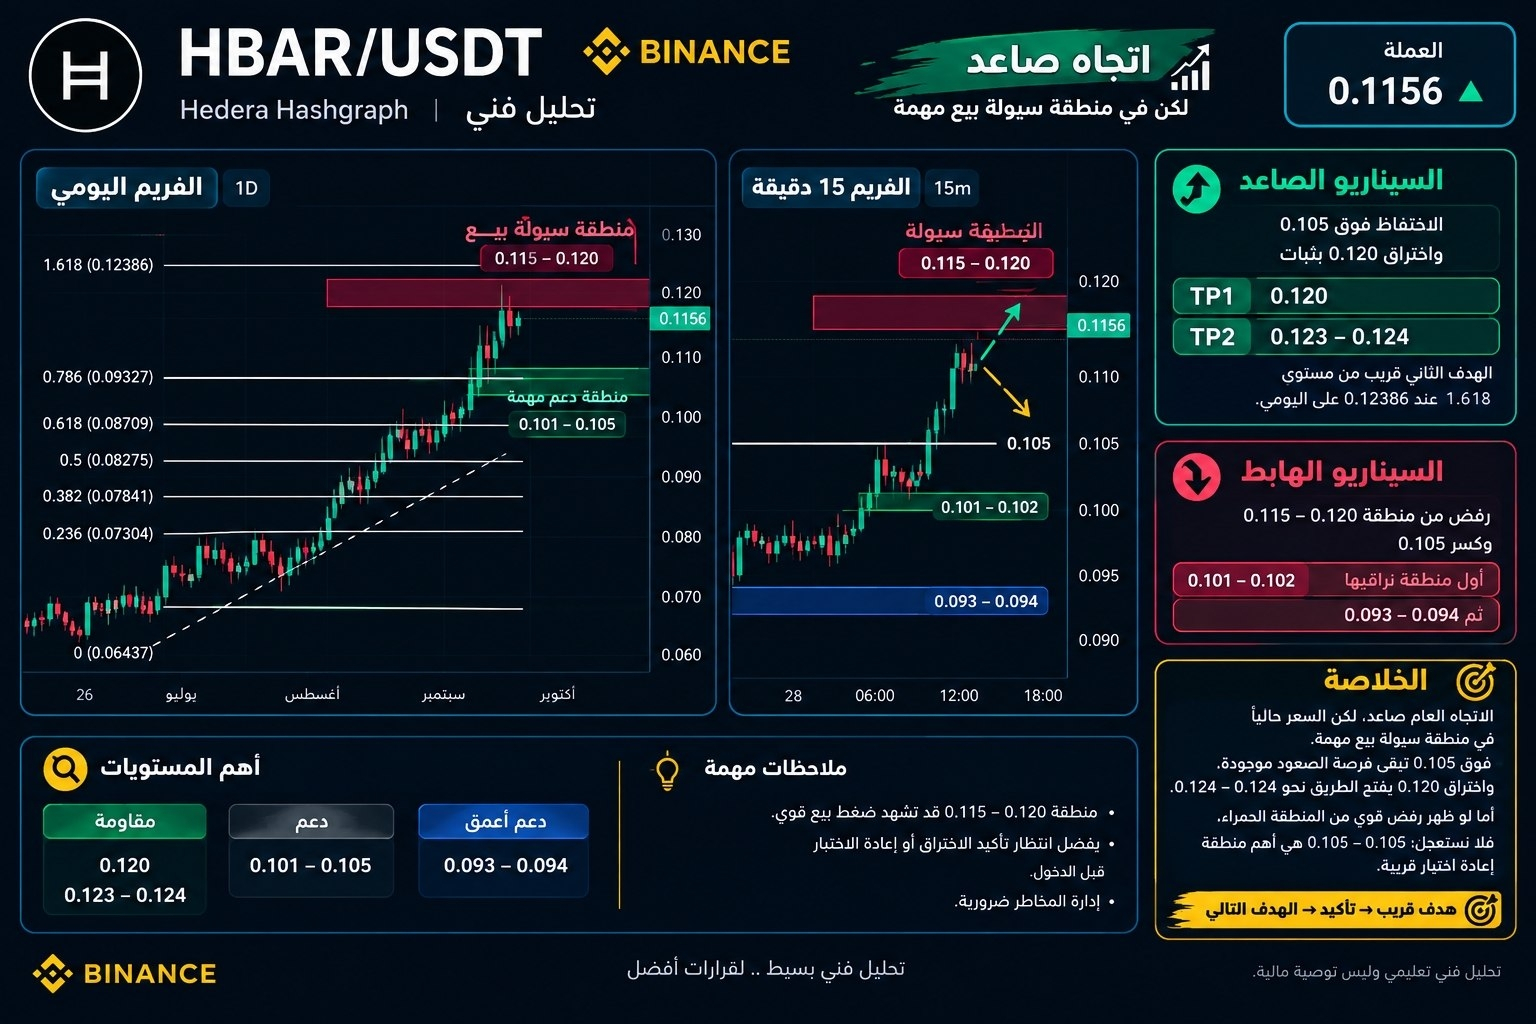
HBAR made a strong bullish move and is currently around 0.1156, but the price has entered a very important area on the daily timeframe: the sell-liquidity zone drawn with the red rectangle.
📊 On the daily timeframe: The overall trend is still bullish, and the price strongly broke above 0.1011. However, the 0.115–0.120 zone requires caution, because it’s an area where selling pressure and profit-taking may appear.
📈 On the 15M timeframe: The move is still strong, but after the fast rally, it’s better to wait for confirmation or a retest rather than chasing the price.
🟢 Scenario 1 — Continuation of the uptrend
If the price holds above 0.105–0.101 and successfully breaks 0.120 with stability:
🎯 TP1: 0.120 🎯 TP2: 0.123–0.124
And the second target here is close to the 1.618 level at 0.12386 on the daily timeframe.
🔻 Scenario 2 — Correction
If there is a rejection from the 0.115–0.120 zone and the price breaks below 0.105:
📍 First area to watch: 0.101–0.102 📍 If the correction continues: 0.093–0.094
🎯 Summary: HBAR’s bias is bullish, but the price is currently in a zone where we must respect the sell pressure. Above 0.105, the opportunity for the uptrend to continue remains, and a break above 0.120 opens the path toward 0.123–0.124. But if a strong rejection appears from the red zone, don’t rush; 0.101–0.105 is the most important nearby retest area.
⚠️ Educational technical analysis, not financial advice.