
....


Post

Abo Hor
·
--
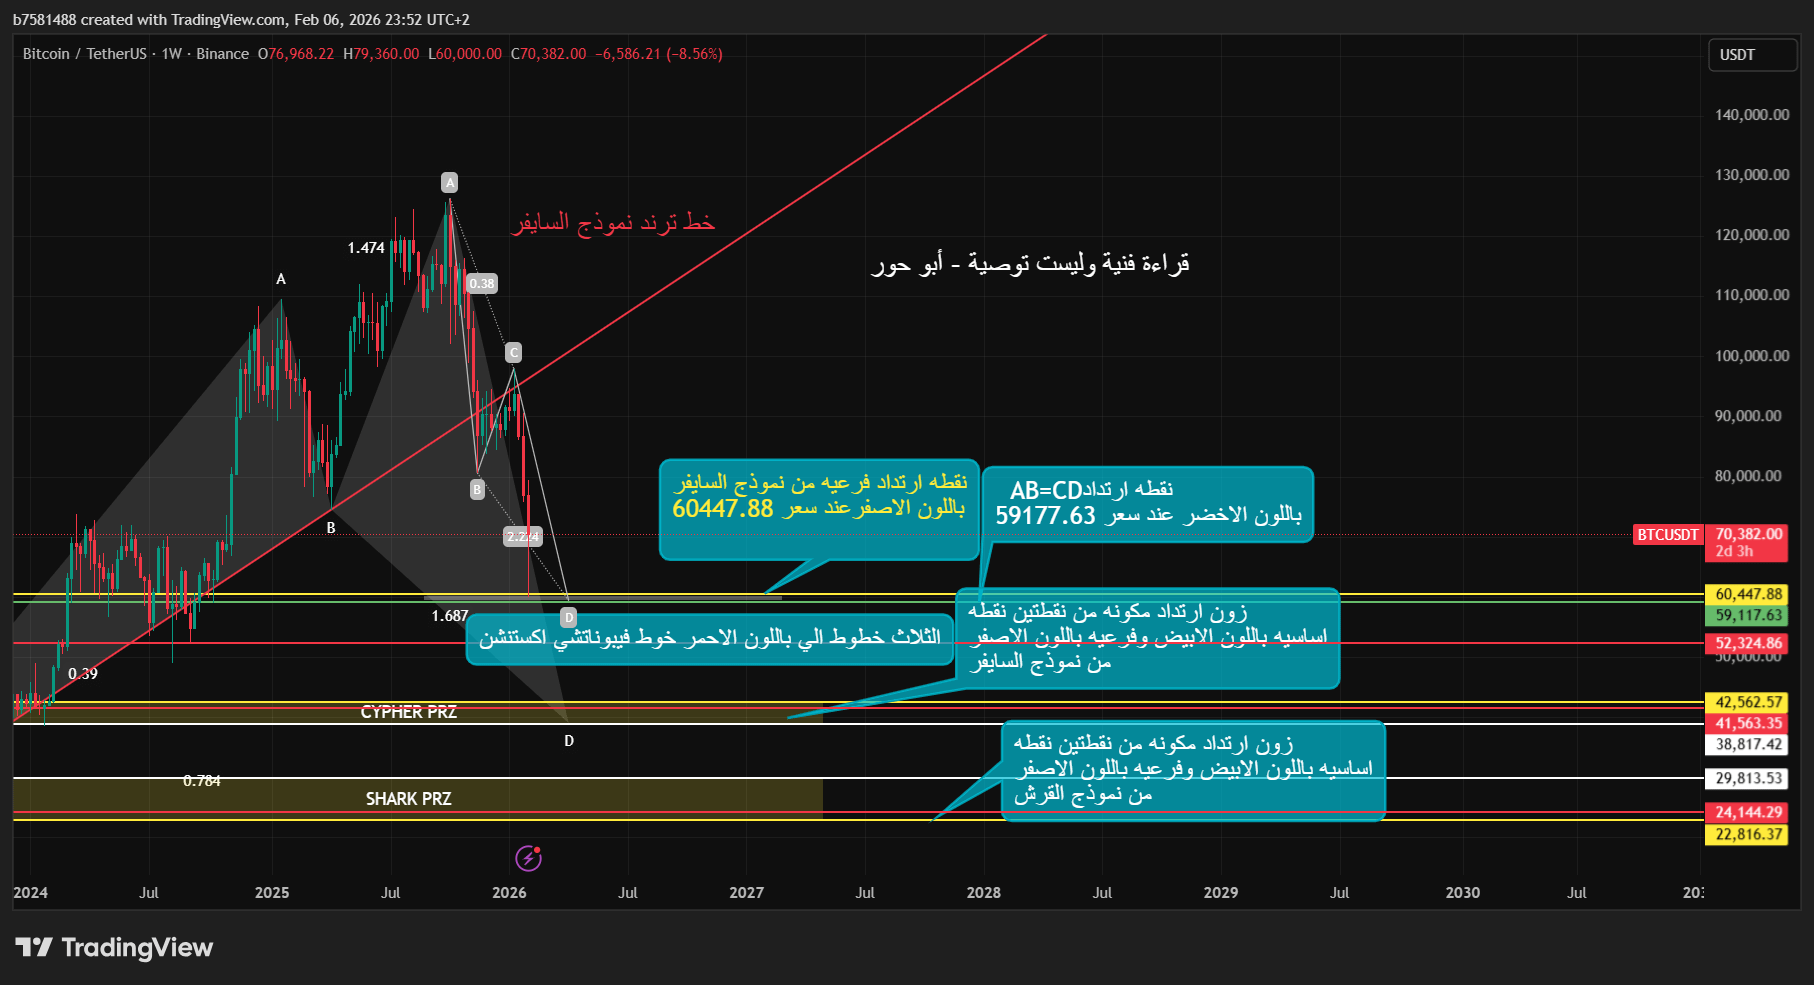
BTCUSDT Analysis – Weekly Time Frame (1W)
Bitcoin has broken a long-term upward trend line, and with the break, a strong downward acceleration appeared, bringing the price to historically significant demand areas that align with more than one harmonic pattern.
AB=CD Pattern
The lengths of sides AB and CD are equal.
Technical rebound target: _59,177 (in green)
And a minor rebound point at the price of 60,447 from the Cypher pattern.
Cypher Pattern
The pattern completes at point D defined in the image between 42,562 and 38,817, and there is a confluence support that enhances the likelihood of a price reaction.
Shark Pattern
The deep rebound range is between: 29,813 and 24,144
A high liquidity area if selling pressure continues.
Technical summary: _We are facing a confluence area of Harmonic patterns + price support + end of a downward wave.
Any consistent weekly close above 60,000$ may signal the beginning of a medium-term rebound.
A consistent break below 59,000$ opens the way to test the deeper (Cypher) and (Shark) areas.
My humble view, your brother Abu Hur..
Bitcoin has broken a long-term upward trend line, and with the break, a strong downward acceleration appeared, bringing the price to historically significant demand areas that align with more than one harmonic pattern.
AB=CD Pattern
The lengths of sides AB and CD are equal.
Technical rebound target: _59,177 (in green)
And a minor rebound point at the price of 60,447 from the Cypher pattern.
Cypher Pattern
The pattern completes at point D defined in the image between 42,562 and 38,817, and there is a confluence support that enhances the likelihood of a price reaction.
Shark Pattern
The deep rebound range is between: 29,813 and 24,144
A high liquidity area if selling pressure continues.
Technical summary: _We are facing a confluence area of Harmonic patterns + price support + end of a downward wave.
Any consistent weekly close above 60,000$ may signal the beginning of a medium-term rebound.
A consistent break below 59,000$ opens the way to test the deeper (Cypher) and (Shark) areas.
My humble view, your brother Abu Hur..
Disclaimer: Includes third-party opinions. No advice. Binance AI may be used without guarantee. See T&Cs.