$GIGGLE : 📊 Bounce point or continuous drop in GIGGLE?
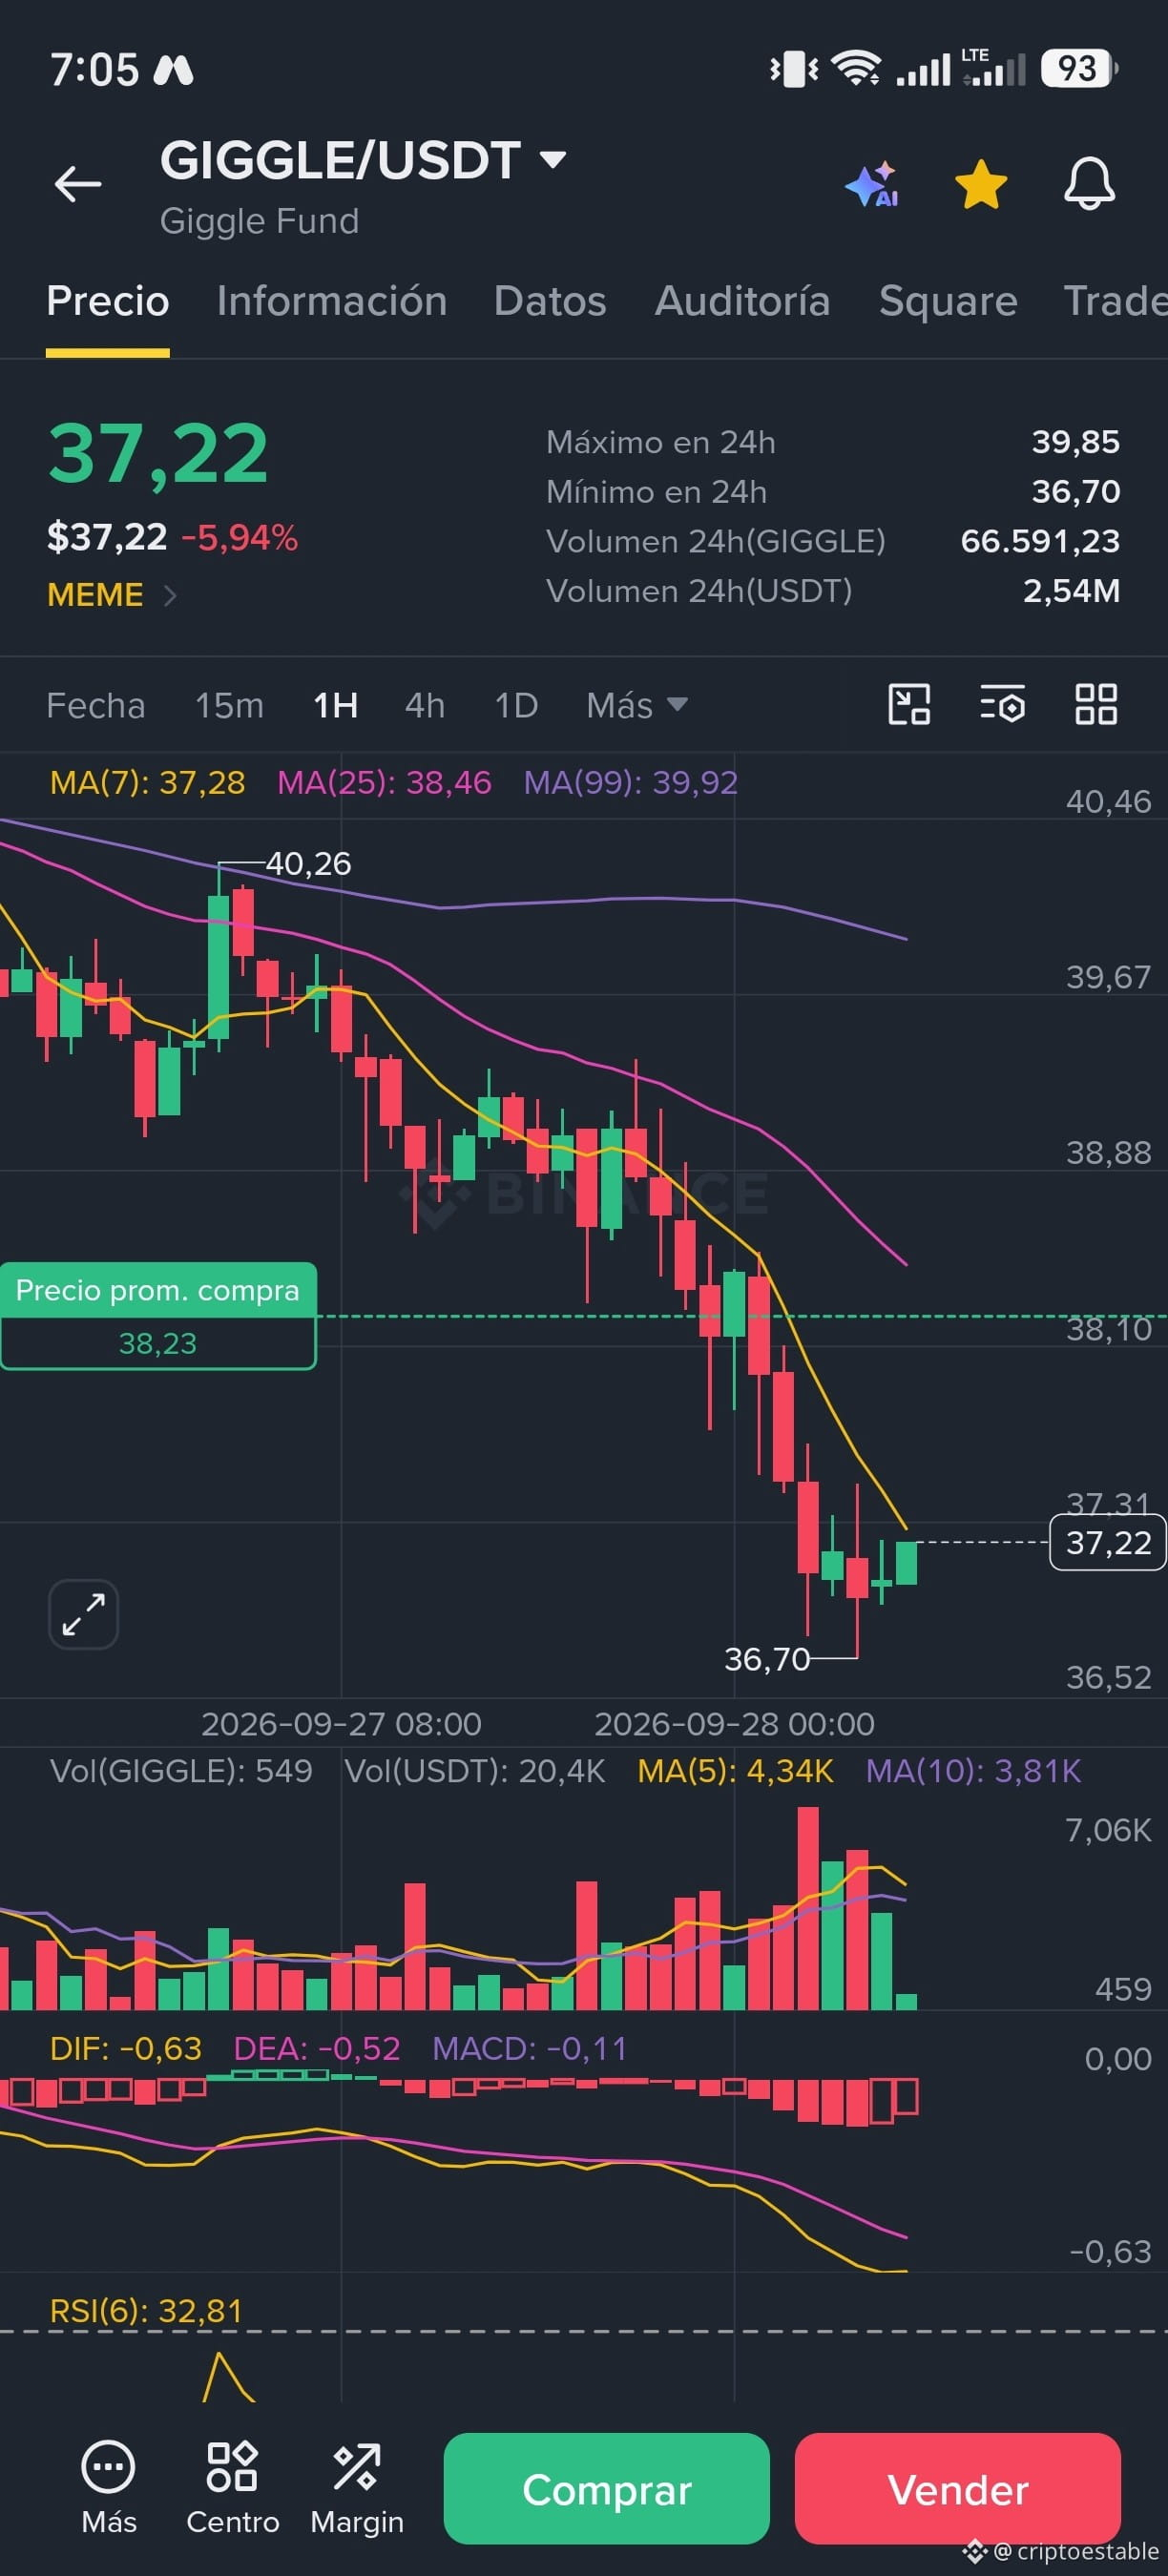
Analyzing the 1-hour chart of $GIGGLE /USDT:
Current price: $37.22 (-5.94%)
Indicators: RSI(6) is at 32.81, hovering near the extreme oversold zone.
Moving Averages: Trading below MA(7) at 37.28 and MA(25) at 38.46, showing bearish pressure after losing the previous support at $38.10.
Key Support: It briefly bounced at the $36.70 low.
Will it manage to hold the floor at $36.70 to seek recovery toward the average buy price ($38.23), or will it break down to new lows?
💬 Are you accumulating during this pullback or waiting for trend confirmation?
#GIGGLE #CryptoAnalysis #BinanceSquare #TechnicalAnalysis #Trading
Analyzing the 1-hour chart of $GIGGLE /USDT:
Current price: $37.22 (-5.94%)
Indicators: RSI(6) is at 32.81, hovering near the extreme oversold zone.
Moving Averages: Trading below MA(7) at 37.28 and MA(25) at 38.46, showing bearish pressure after losing the previous support at $38.10.
Key Support: It briefly bounced at the $36.70 low.
Will it manage to hold the floor at $36.70 to seek recovery toward the average buy price ($38.23), or will it break down to new lows?
💬 Are you accumulating during this pullback or waiting for trend confirmation?
#GIGGLE #CryptoAnalysis #BinanceSquare #TechnicalAnalysis #Trading