#QNT #合约异动 $QNT 仍在币安U本位永续涨幅榜前列,但刚结束的一小时,已把上一篇提出的走弱条件真正走出来了。我暂时观望:榜单上的正涨幅与眼前的下跌可以同时成立;只看前者,会错过风险正在换挡。
At 17:21 Beijing time, the full leaderboard covered 525 eligible trading pairs. QNT ranked #2, with a rolling 24-hour gain of about +27.12% and trading volume of about 2.643 billion USDT. This increase still includes the earlier sharp rally. My focus has shifted from “whether the pullback can stop” to “after a high-volume breakdown, whether there is still sustained buy support.”
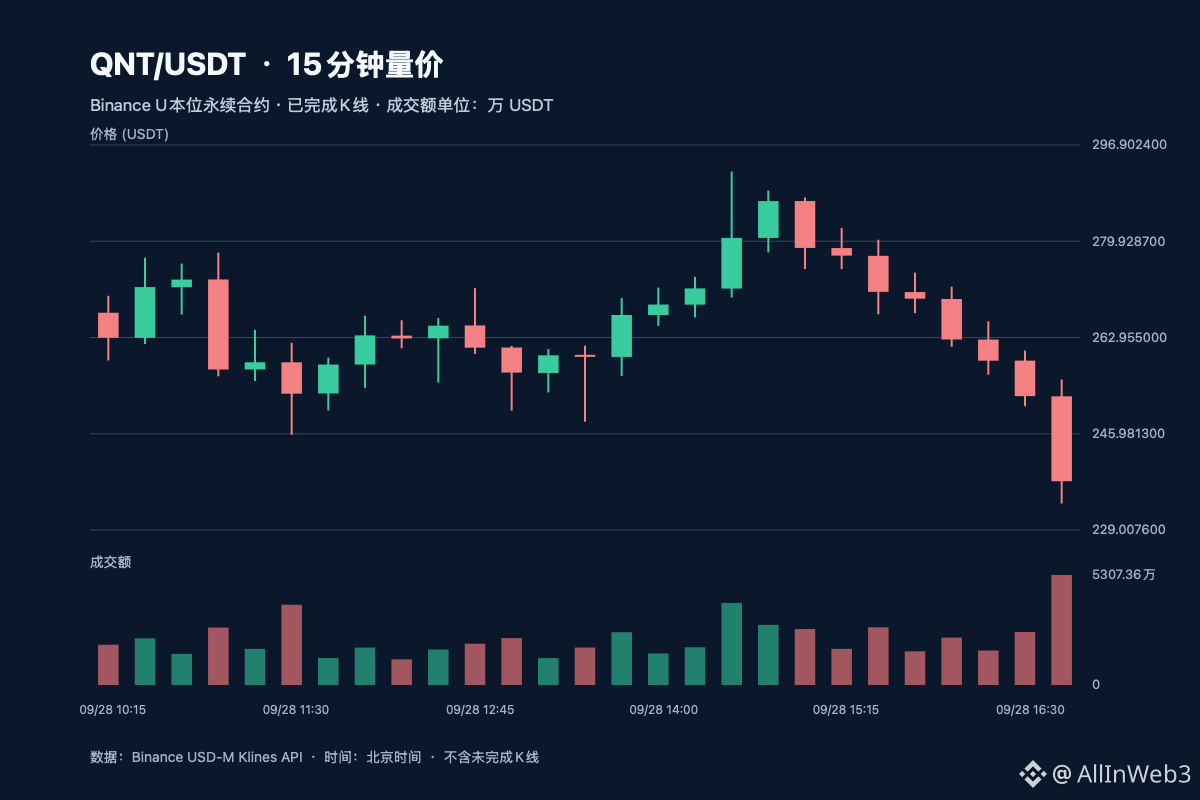
In my previous note, I saw the 15:00–16:00 hour close at 269.80 and suggested that if it continued to close below 270.23 and then broke below 267.05, the prior push higher should be treated as a more clearly failed breakout. The newly completed 16:00–17:00 hour opened at 269.75, hit a low of 233.69, and closed at 237.61—down about 11.91% from the open. This is not an intrabar wick: four consecutive 15-minute candles closed at 262.60, 258.86, 252.62, and finally 237.61.
Trading volume also hasn’t shrunk. Contract trading value for that hour was about 118.17 million USDT, up roughly 33.5% from about 88.52 million USDT in the prior hour; and the last 15 minutes alone accounted for about 53.07 million, nearly 45% of the whole hour. Spot for the same period fell from 269.96 to 237.52, so the direction is close. Therefore, this breakdown appeared simultaneously in both spot and contracts, but these data cannot prove which side sold first, nor can trading value alone be taken as direct evidence of net outflows of funds.
The signal from open interest is more restrained: the number of open contracts rose from about 173,500 at 16:00 to about 174,700 at 17:00—around +0.69%. The latest funding rate is close to zero. A big price drop alongside slightly higher open interest suggests that positions are still rotating between new and old; you can’t conclude from total aggregate volume alone whether longs are being liquidated or shorts are piling in. If you want a single explanation for the selloff, public data at the moment is insufficient. The cooperation announcement between Quant and The Clearing House was released on September 24, so you can’t use that older announcement to explain this hour’s downturn.
My view is: after 267.05 breaks, the short-term repair hypothesis has been clearly weakened. Next, we should first see whether the full hour can reclaim that level, and whether trading volume picks up during any rebound. If it’s only a brief dead-cat bounce and then falls back below 233.69, it means buy support remains weak; if it regains the level and shows consecutive hours with trading activity support, then you would need to revise the assessment. Will you interpret this as normal position rotation after a sudden surge, or as a trend that has already weakened? What will be the key evidence—the next full candlestick? After all, which one will you use to judge?
At 17:21 Beijing time, the full leaderboard covered 525 eligible trading pairs. QNT ranked #2, with a rolling 24-hour gain of about +27.12% and trading volume of about 2.643 billion USDT. This increase still includes the earlier sharp rally. My focus has shifted from “whether the pullback can stop” to “after a high-volume breakdown, whether there is still sustained buy support.”
In my previous note, I saw the 15:00–16:00 hour close at 269.80 and suggested that if it continued to close below 270.23 and then broke below 267.05, the prior push higher should be treated as a more clearly failed breakout. The newly completed 16:00–17:00 hour opened at 269.75, hit a low of 233.69, and closed at 237.61—down about 11.91% from the open. This is not an intrabar wick: four consecutive 15-minute candles closed at 262.60, 258.86, 252.62, and finally 237.61.
Trading volume also hasn’t shrunk. Contract trading value for that hour was about 118.17 million USDT, up roughly 33.5% from about 88.52 million USDT in the prior hour; and the last 15 minutes alone accounted for about 53.07 million, nearly 45% of the whole hour. Spot for the same period fell from 269.96 to 237.52, so the direction is close. Therefore, this breakdown appeared simultaneously in both spot and contracts, but these data cannot prove which side sold first, nor can trading value alone be taken as direct evidence of net outflows of funds.
The signal from open interest is more restrained: the number of open contracts rose from about 173,500 at 16:00 to about 174,700 at 17:00—around +0.69%. The latest funding rate is close to zero. A big price drop alongside slightly higher open interest suggests that positions are still rotating between new and old; you can’t conclude from total aggregate volume alone whether longs are being liquidated or shorts are piling in. If you want a single explanation for the selloff, public data at the moment is insufficient. The cooperation announcement between Quant and The Clearing House was released on September 24, so you can’t use that older announcement to explain this hour’s downturn.
My view is: after 267.05 breaks, the short-term repair hypothesis has been clearly weakened. Next, we should first see whether the full hour can reclaim that level, and whether trading volume picks up during any rebound. If it’s only a brief dead-cat bounce and then falls back below 233.69, it means buy support remains weak; if it regains the level and shows consecutive hours with trading activity support, then you would need to revise the assessment. Will you interpret this as normal position rotation after a sudden surge, or as a trend that has already weakened? What will be the key evidence—the next full candlestick? After all, which one will you use to judge?