Analysis of the PAXG/USDT asset for the Binance community
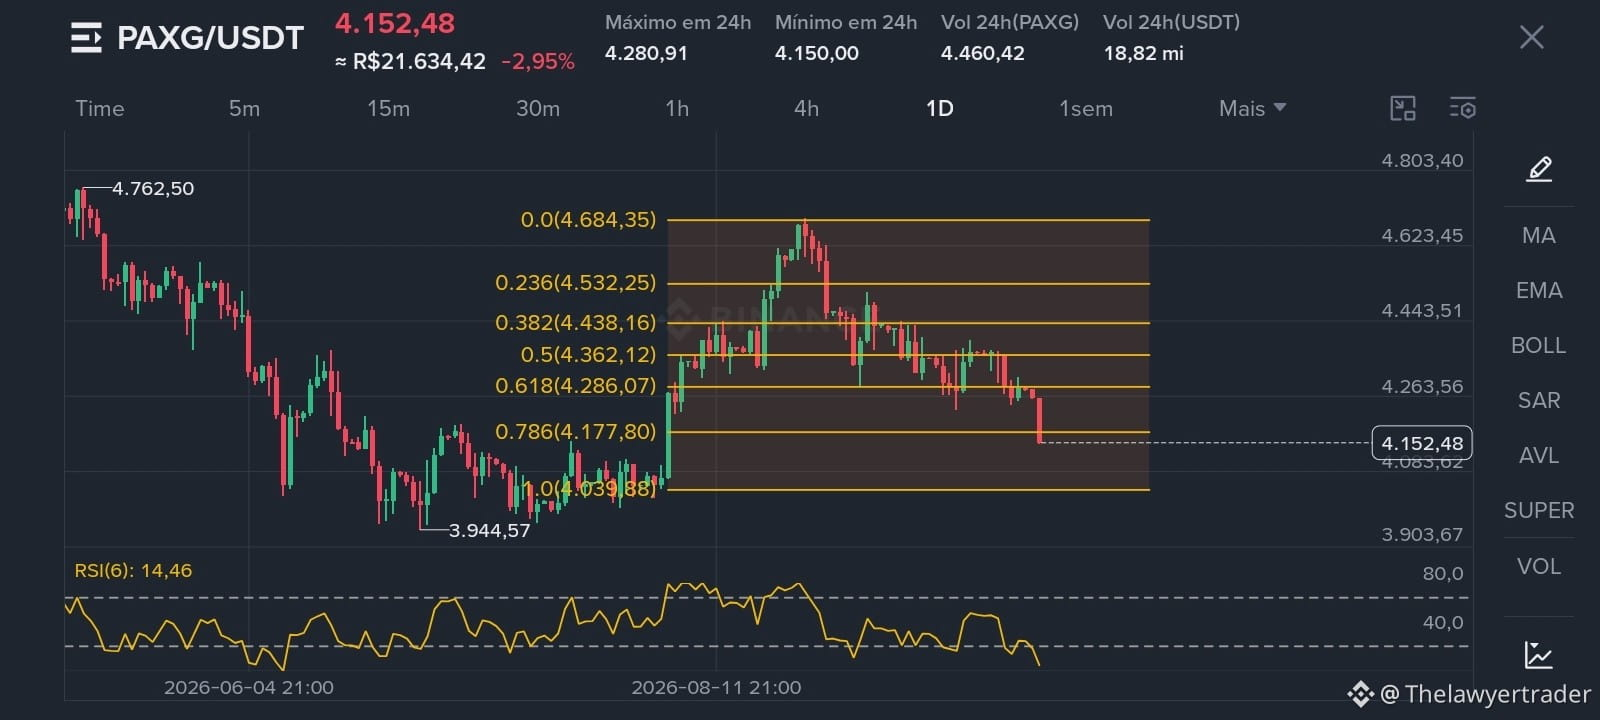
PAXG (Pax Gold, tokenized gold) shows, on the daily chart, a sharp corrective move after reaching the local top at 4,684.35 USDT.
The current price is at 4,152.48 USDT, breaking down below the 0.786 Fibonacci retracement level (4,177.80), which confirms bearish momentum in the short term.
Visible chart pattern: there is a bearish breakout of the Fibonacci retracement supports, with the next relevant technical support at the base of the retracement, at 4,039.88 USDT. The immediate resistance is in the 4,177.80 range. The probability of the decline continuing toward the 4,039.88 zone is moderate to high, given the break of the 0.786 level.
Point of attention: the RSI (6) is at 14.46, an extreme oversold condition. This often precedes bounces or attempts to stabilize, so it’s worth watching whether there will be a buying reaction in the support zone before confirming the continuation of the downward trend.
Conclusion: short-term bearish trend, with a likely target at 4,039.88, but with the risk of a technical rebound due to oversold conditions.
Analysis based exclusively on chart reading, and does not constitute investment advice.
#PAXGTutorialanalysis $PAXG
PAXG (Pax Gold, tokenized gold) shows, on the daily chart, a sharp corrective move after reaching the local top at 4,684.35 USDT.
The current price is at 4,152.48 USDT, breaking down below the 0.786 Fibonacci retracement level (4,177.80), which confirms bearish momentum in the short term.
Visible chart pattern: there is a bearish breakout of the Fibonacci retracement supports, with the next relevant technical support at the base of the retracement, at 4,039.88 USDT. The immediate resistance is in the 4,177.80 range. The probability of the decline continuing toward the 4,039.88 zone is moderate to high, given the break of the 0.786 level.
Point of attention: the RSI (6) is at 14.46, an extreme oversold condition. This often precedes bounces or attempts to stabilize, so it’s worth watching whether there will be a buying reaction in the support zone before confirming the continuation of the downward trend.
Conclusion: short-term bearish trend, with a likely target at 4,039.88, but with the risk of a technical rebound due to oversold conditions.
Analysis based exclusively on chart reading, and does not constitute investment advice.
#PAXGTutorialanalysis $PAXG