💥Technical analysis: Trading scenario $XAU and important price levels
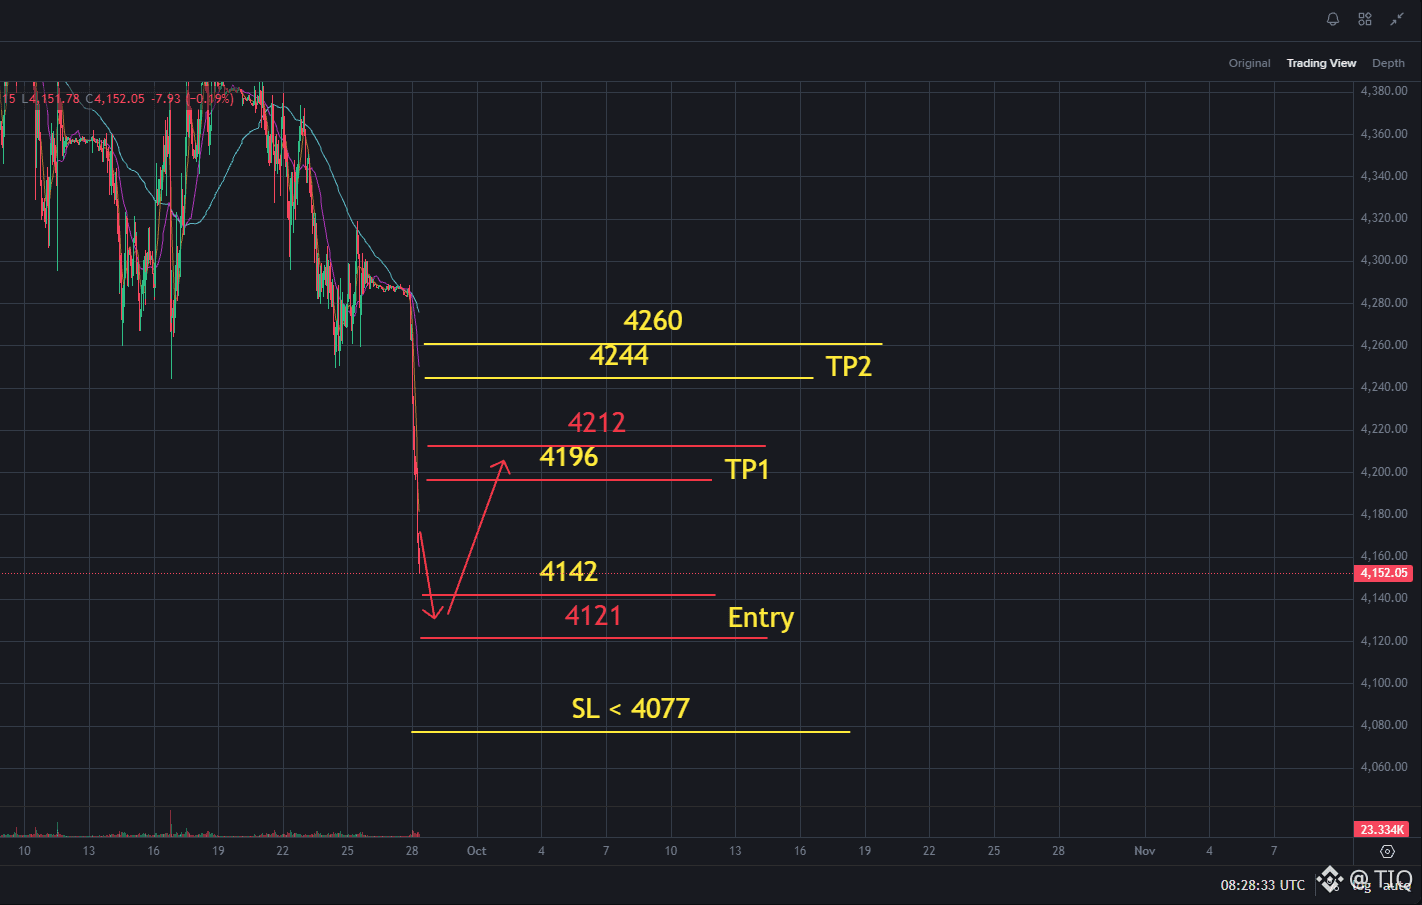
💥The market has just gone through a strong decline from the previous peak area and is now approaching a potential support zone. Based on the current technical chart, the price is trading around 4152. It is expected that the price will have a minor pullback down to the support area below to accumulate buying power before entering the technical rebound wave.
💥Short-term forecast trend: Pull back to test the support zone to form a short-term bottom, then rebound upward toward the resistance levels above
👉Entry Long: 4121 - 4142.
💥Stop Loss - SL: < 4,077
🎉TP1 : 4196 - 4212
🎉TP2 : 4244 - 4260
💥Note: This analysis is based on technical data from the chart and is for reference only. Always maintain risk management discipline and set an appropriate Stop Loss for each trade
Click here to view the chart #GOLD 👇👇👇
💥The market has just gone through a strong decline from the previous peak area and is now approaching a potential support zone. Based on the current technical chart, the price is trading around 4152. It is expected that the price will have a minor pullback down to the support area below to accumulate buying power before entering the technical rebound wave.
💥Short-term forecast trend: Pull back to test the support zone to form a short-term bottom, then rebound upward toward the resistance levels above
👉Entry Long: 4121 - 4142.
💥Stop Loss - SL: < 4,077
🎉TP1 : 4196 - 4212
🎉TP2 : 4244 - 4260
💥Note: This analysis is based on technical data from the chart and is for reference only. Always maintain risk management discipline and set an appropriate Stop Loss for each trade
Click here to view the chart #GOLD 👇👇👇