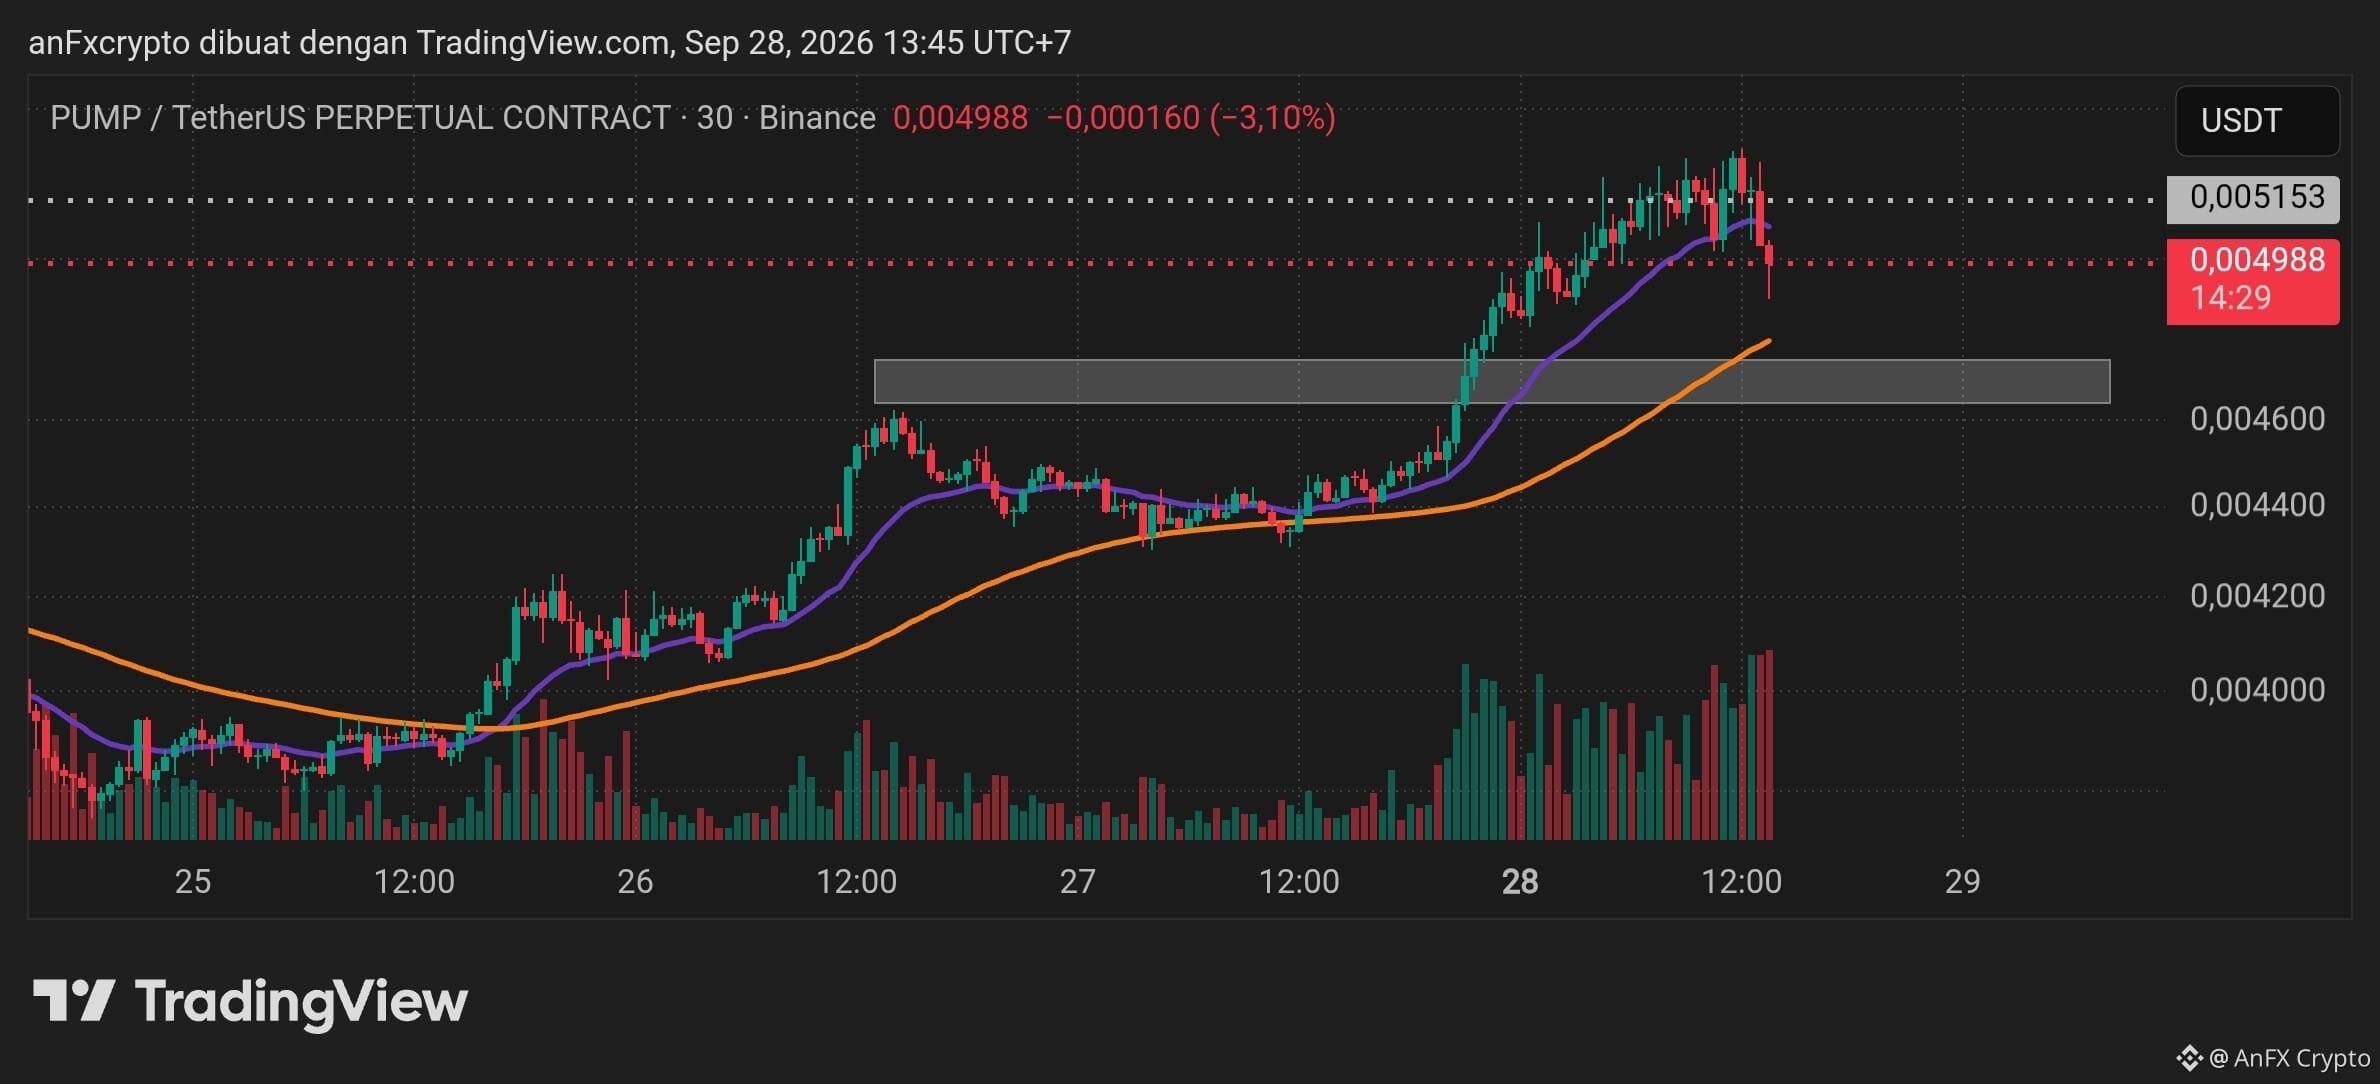
The following is a technical analysis and trading signals for the $PUMP /USDT pair (Perpetual Contract - Timeframe 30M:
1. Market Structure & Technical Analysis
Main Trend: Bullish / Uptrend. Price is forming a strong Higher High and Higher Low structure since the date range 25–28.
Current Conditions: Price is experiencing a fairly significant rejection in the Resistance/Local High area around 0.005153. The latest sharp red candle suggests profit-taking activity or a liquidity sweep before continuing the main trend.
Key Area (Demand Zone): The gray box in the range 0.004600 – 0.004750 is a highly potential Order Block / Support RBS (Resistance Becomes Support) area that can hold price declines and serve as a bounce point.
Moving Average (MA): Current price is above the long-term Moving Average (orange line). A pullback toward the orange MA within the gray box area will be a low-risk entry opportunity.
2. Trading Signal (Trade Plan)
Main Option: LONG (Buy on Dip / Retest Demand Zone)
The best strategy is to take advantage of price corrections into the support/demand area.
Entry Zone: $0,004620 – $0,004720 (Wait for confirmation of a reversal / candle rejection in the gray box area)
Stop Loss (SL): $0,004480 (Below the lower boundary of the demand zone)
Take Profit 1 (TP1): $0,004980
Take Profit 2 (TP2): $0,005150 (Retest High)
Take Profit 3 (TP3): $0,005400 (Expansion Breakout High)
Risk to Reward Ratio: ~ 1 : 2.5+
Alternative Option: SHORT (Counter-Trend / Aggressive Scalping)
Only for experienced traders who want to take advantage of short-term corrections toward the Demand area.
Entry Zone: $0,004980 – $0,005020
Stop Loss (SL): $0,005180 (Above the tail of the highest candle)
Take Profit (TP): $0,004700 (Demand area target)
1. Market Structure & Technical Analysis
Main Trend: Bullish / Uptrend. Price is forming a strong Higher High and Higher Low structure since the date range 25–28.
Current Conditions: Price is experiencing a fairly significant rejection in the Resistance/Local High area around 0.005153. The latest sharp red candle suggests profit-taking activity or a liquidity sweep before continuing the main trend.
Key Area (Demand Zone): The gray box in the range 0.004600 – 0.004750 is a highly potential Order Block / Support RBS (Resistance Becomes Support) area that can hold price declines and serve as a bounce point.
Moving Average (MA): Current price is above the long-term Moving Average (orange line). A pullback toward the orange MA within the gray box area will be a low-risk entry opportunity.
2. Trading Signal (Trade Plan)
Main Option: LONG (Buy on Dip / Retest Demand Zone)
The best strategy is to take advantage of price corrections into the support/demand area.
Entry Zone: $0,004620 – $0,004720 (Wait for confirmation of a reversal / candle rejection in the gray box area)
Stop Loss (SL): $0,004480 (Below the lower boundary of the demand zone)
Take Profit 1 (TP1): $0,004980
Take Profit 2 (TP2): $0,005150 (Retest High)
Take Profit 3 (TP3): $0,005400 (Expansion Breakout High)
Risk to Reward Ratio: ~ 1 : 2.5+
Alternative Option: SHORT (Counter-Trend / Aggressive Scalping)
Only for experienced traders who want to take advantage of short-term corrections toward the Demand area.
Entry Zone: $0,004980 – $0,005020
Stop Loss (SL): $0,005180 (Above the tail of the highest candle)
Take Profit (TP): $0,004700 (Demand area target)