₿ Where can Bitcoin accelerate? Let’s look at the liquidation map.
Price doesn’t always move randomly. Sometimes a clear mechanism lies behind a strong impulse—liquidation of leveraged positions.
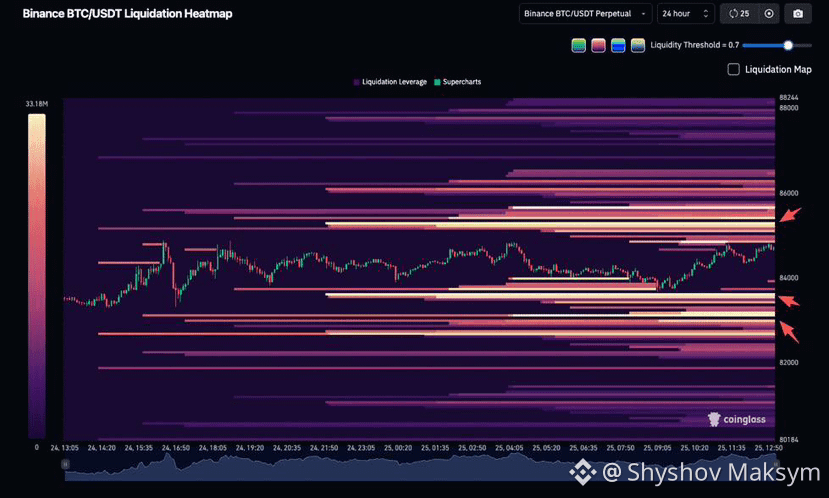
Coinglass’s Liquidation Heatmap shows areas where large volumes of liquidations may be concentrated. The brighter the zone, the more positions could be forcibly closed if the price reaches it.
Right now, two main directions stand out:
🔼 $85,300–86,000 — a zone of potential short liquidations.
🔽 $83,300–83,700 and $82,600–83,100 — zones of potential long liquidations.
Why does this matter?
Forced position closures can create additional market pressure and speed up price movement. For example, short liquidations involve buying back the asset, which can push the price even higher.
But there’s a catch 👇
A liquidation map is not a forecast and not a guarantee that price will move to a specific level.
These zones aren’t ordinary limit orders, and their volume changes depending on positions being opened and closed.
That’s why I treat the Heatmap as an additional tool that works best together with market structure, key levels, and Open Interest.
And do you use the Liquidation Heatmap in your analysis? 👀
$BTC
Price doesn’t always move randomly. Sometimes a clear mechanism lies behind a strong impulse—liquidation of leveraged positions.
Coinglass’s Liquidation Heatmap shows areas where large volumes of liquidations may be concentrated. The brighter the zone, the more positions could be forcibly closed if the price reaches it.
Right now, two main directions stand out:
🔼 $85,300–86,000 — a zone of potential short liquidations.
🔽 $83,300–83,700 and $82,600–83,100 — zones of potential long liquidations.
Why does this matter?
Forced position closures can create additional market pressure and speed up price movement. For example, short liquidations involve buying back the asset, which can push the price even higher.
But there’s a catch 👇
A liquidation map is not a forecast and not a guarantee that price will move to a specific level.
These zones aren’t ordinary limit orders, and their volume changes depending on positions being opened and closed.
That’s why I treat the Heatmap as an additional tool that works best together with market structure, key levels, and Open Interest.
And do you use the Liquidation Heatmap in your analysis? 👀
$BTC