🚀 ETHEREUM IN A CORRECTION ZONE: SUPPORT AND KEY TREND! ⚡
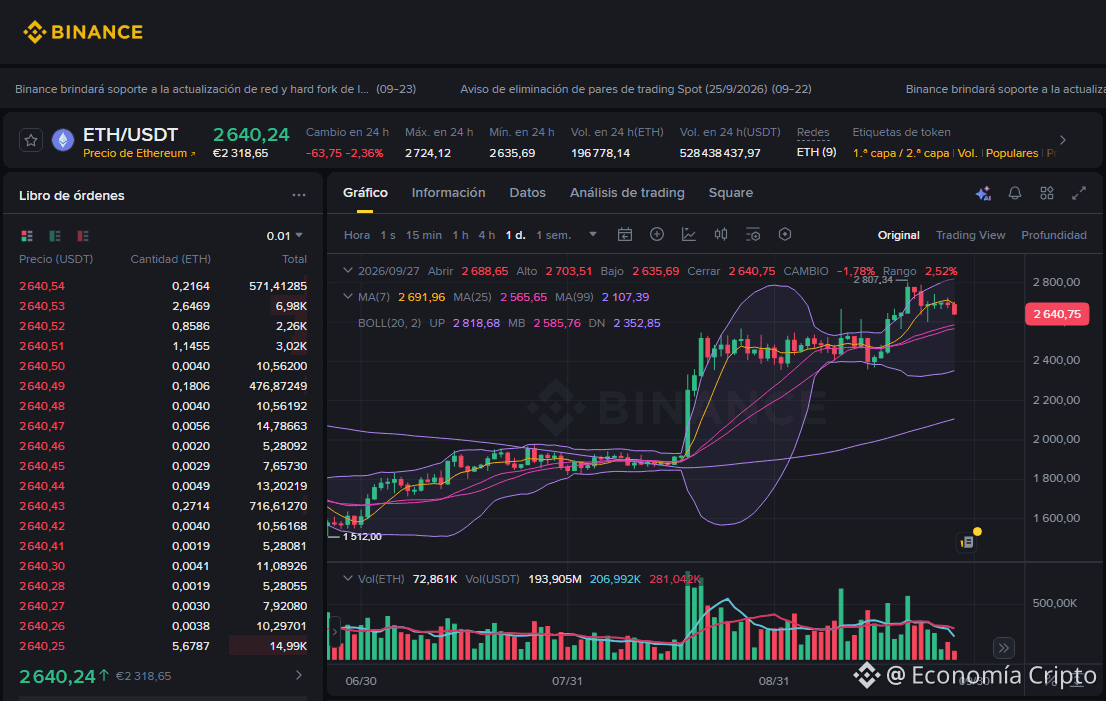
The ETH/USDT pair is trading at 2,640.24, recording a change of -2.36% over the last 24 hours. The daily session shows an open at 2,688.65, a high of 2,703.51, a low of 2,635.69, and a close of 2,640.75 (-1.78%), reflecting a pullback and technical adjustment phase in the market.
🔍 Trend Analysis and Indicators
Trend: Sideways-to-bullish in the short term within a solid long-term bullish macro structure.
Moving Averages: The price is slightly below the MA(7) (2,691.96), but remains firm above the MA(25) (2,565.65) and the long-term trend supported by the MA(99) (2,107.39).
Bollinger Bands: Price is oscillating after retreating from upper zones, seeking stability near the middle band MB (2,585.76), with the upper band UP (2,818.68) and the lower band DN (2,352.85).
Key Levels: Immediate support is found in the 2,635.69 area, while the main resistance to break is located at the recent highs of 2,703.51 - 2,818.68.
💡 Trading Strategy: Buy or Sell?
Buy (Long)?: Approaching mid-term supports and the confirmation from the moving averages offer a tactical accumulation opportunity, managing risk strictly.
Sell (Short)?: Trading to the downside carries higher risk due to the strength of the primary trend; it would only be considered in case of a deep and sustained loss of the lower supports.
#Ethereum #AnalisisTecnico #CryptoTrading
The Lord blesses and prospers whoever operates here, in the name of Jesus, because your word says: "The silver is mine, and the gold is mine," says the LORD of hosts. Hageo 2:8 RV1960-T -
$ETH
The ETH/USDT pair is trading at 2,640.24, recording a change of -2.36% over the last 24 hours. The daily session shows an open at 2,688.65, a high of 2,703.51, a low of 2,635.69, and a close of 2,640.75 (-1.78%), reflecting a pullback and technical adjustment phase in the market.
🔍 Trend Analysis and Indicators
Trend: Sideways-to-bullish in the short term within a solid long-term bullish macro structure.
Moving Averages: The price is slightly below the MA(7) (2,691.96), but remains firm above the MA(25) (2,565.65) and the long-term trend supported by the MA(99) (2,107.39).
Bollinger Bands: Price is oscillating after retreating from upper zones, seeking stability near the middle band MB (2,585.76), with the upper band UP (2,818.68) and the lower band DN (2,352.85).
Key Levels: Immediate support is found in the 2,635.69 area, while the main resistance to break is located at the recent highs of 2,703.51 - 2,818.68.
💡 Trading Strategy: Buy or Sell?
Buy (Long)?: Approaching mid-term supports and the confirmation from the moving averages offer a tactical accumulation opportunity, managing risk strictly.
Sell (Short)?: Trading to the downside carries higher risk due to the strength of the primary trend; it would only be considered in case of a deep and sustained loss of the lower supports.
#Ethereum #AnalisisTecnico #CryptoTrading
The Lord blesses and prospers whoever operates here, in the name of Jesus, because your word says: "The silver is mine, and the gold is mine," says the LORD of hosts. Hageo 2:8 RV1960-T -
$ETH