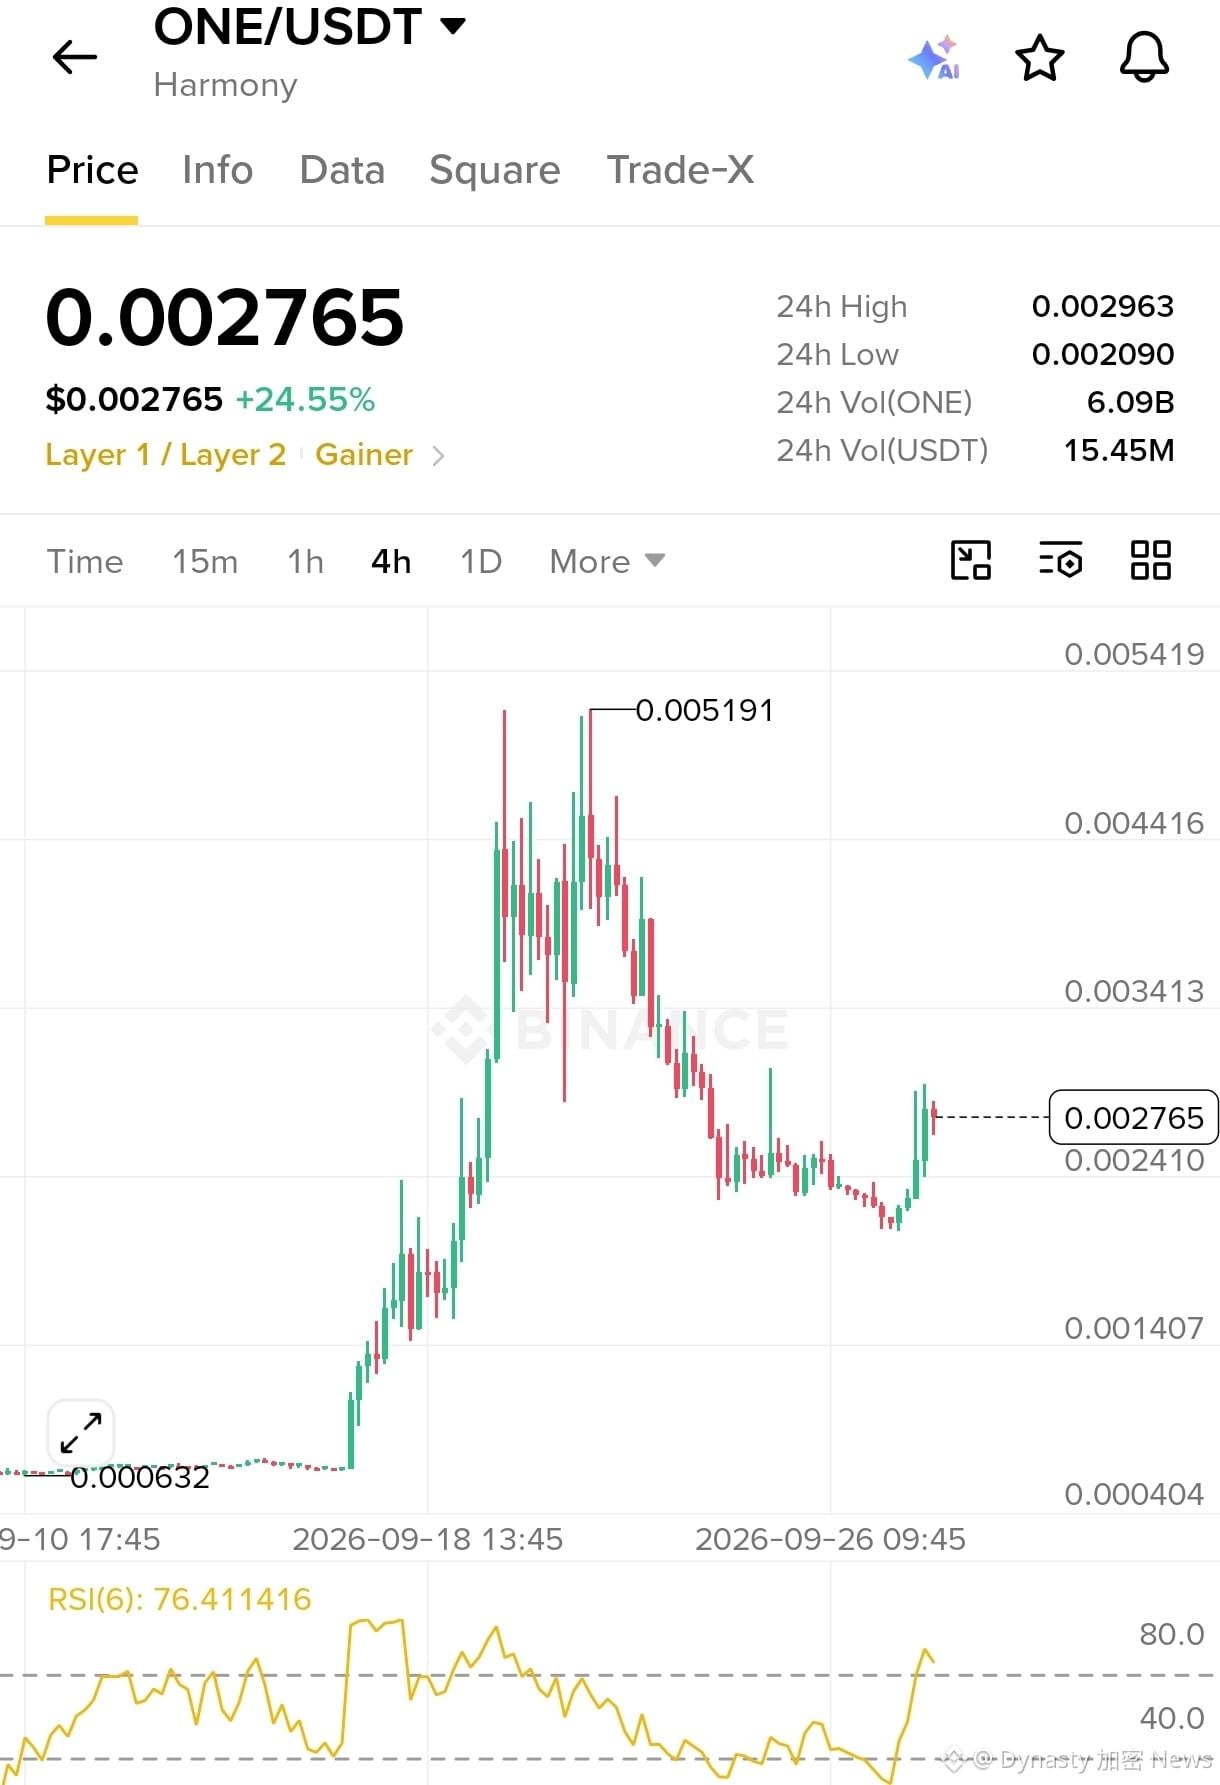
$ONE Spike: What Does the 4H Chart Signal?
$0.002749 (+23.33% 24h gain).
Pattern Analysis: A strong bullish green candle has formed as a breakout from the bottom zone ($0.002410 region).
RSI Status: RSI(6) has reached 74.63, near the overbought zone, indicating strong short-term momentum.
Momentum is strong, but avoid a direct FOMO entry. Volume support is necessary for continuous push. $ONE
$0.002749 (+23.33% 24h gain).
Pattern Analysis: A strong bullish green candle has formed as a breakout from the bottom zone ($0.002410 region).
RSI Status: RSI(6) has reached 74.63, near the overbought zone, indicating strong short-term momentum.
Momentum is strong, but avoid a direct FOMO entry. Volume support is necessary for continuous push. $ONE