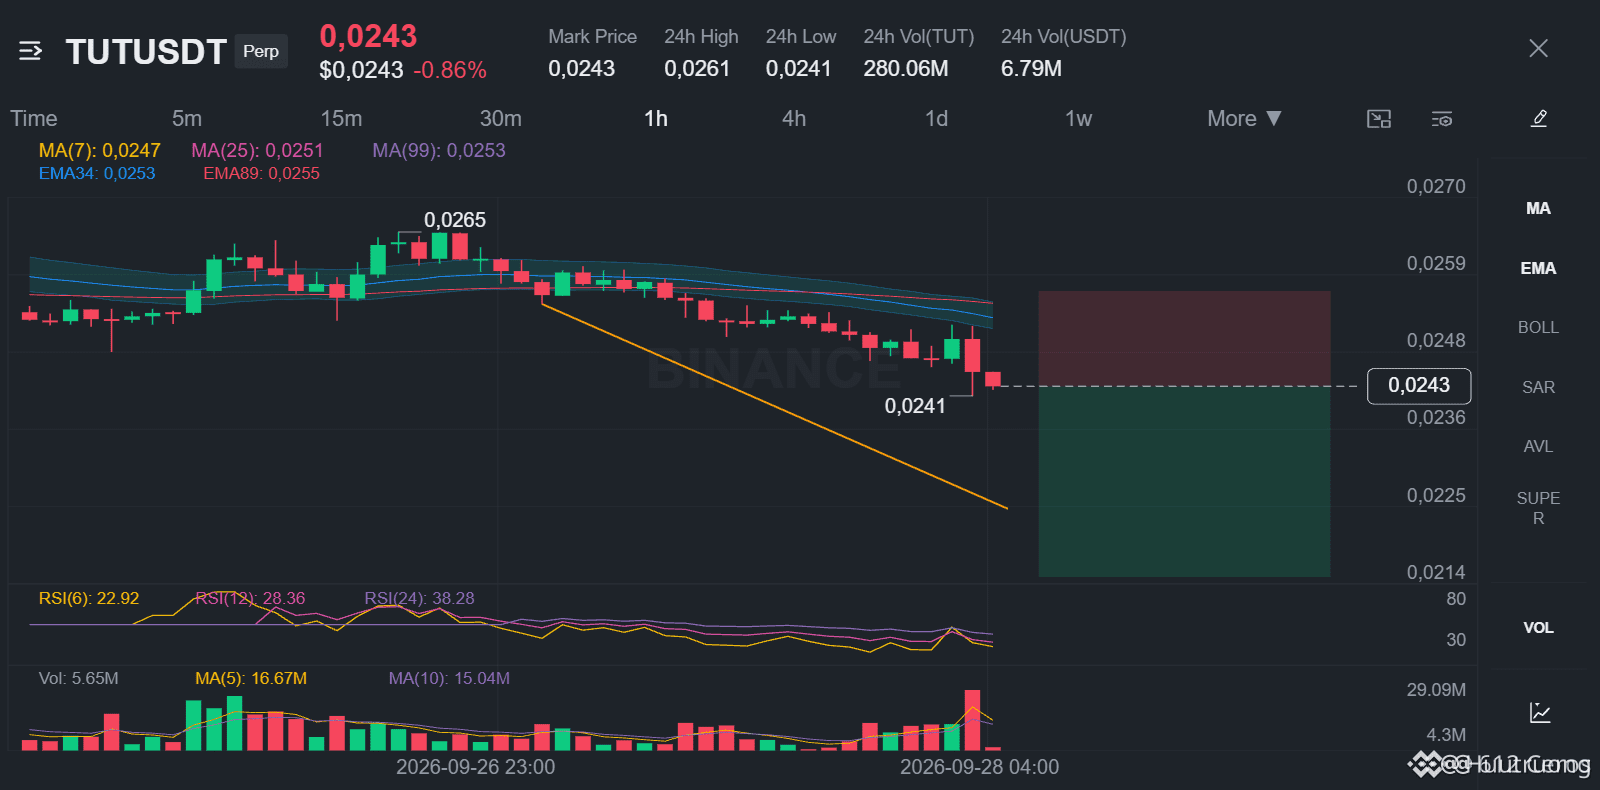
TUT is leaning toward a downtrend; the 1h price range will determine the next step.
📊 $TUT /USDT · Bias: SHORT (Strong) · 6/12 signals in agreement
I have checked: 6/12 signals in agreement
✅ 4h trend direction: price < EMA50 < EMA200, bearish stacking
✅ Trend strength (ADX/DI, 15m): ADX 29.6 with sellers in control (DI+ 11.1 vs DI− 29.8)
✅ BTC context: BTC trend is bearish and correlation is 0.61
✅ RSI 4h: 40.5, downward momentum (below 45)
✅ RSI 1h: 29.7, downward momentum (below 45)
⚠️ Invalidation: the thesis is wrong if it goes above 0.0251160
Conclusion: This setup strongly favors SHORT with a total of 6/12 signals. The strongest supporting factors are the 4h trend showing a falling EMA sequence, the 15m trend strength with ADX at 29.6 and DI− at 29.8, along with the BTC context indicating a bearish trend with correlation 0.61. The main opposing factor is that the daily timeframe trend is still in a mixed range zone; it’s not a clearly defined bearish structure yet.
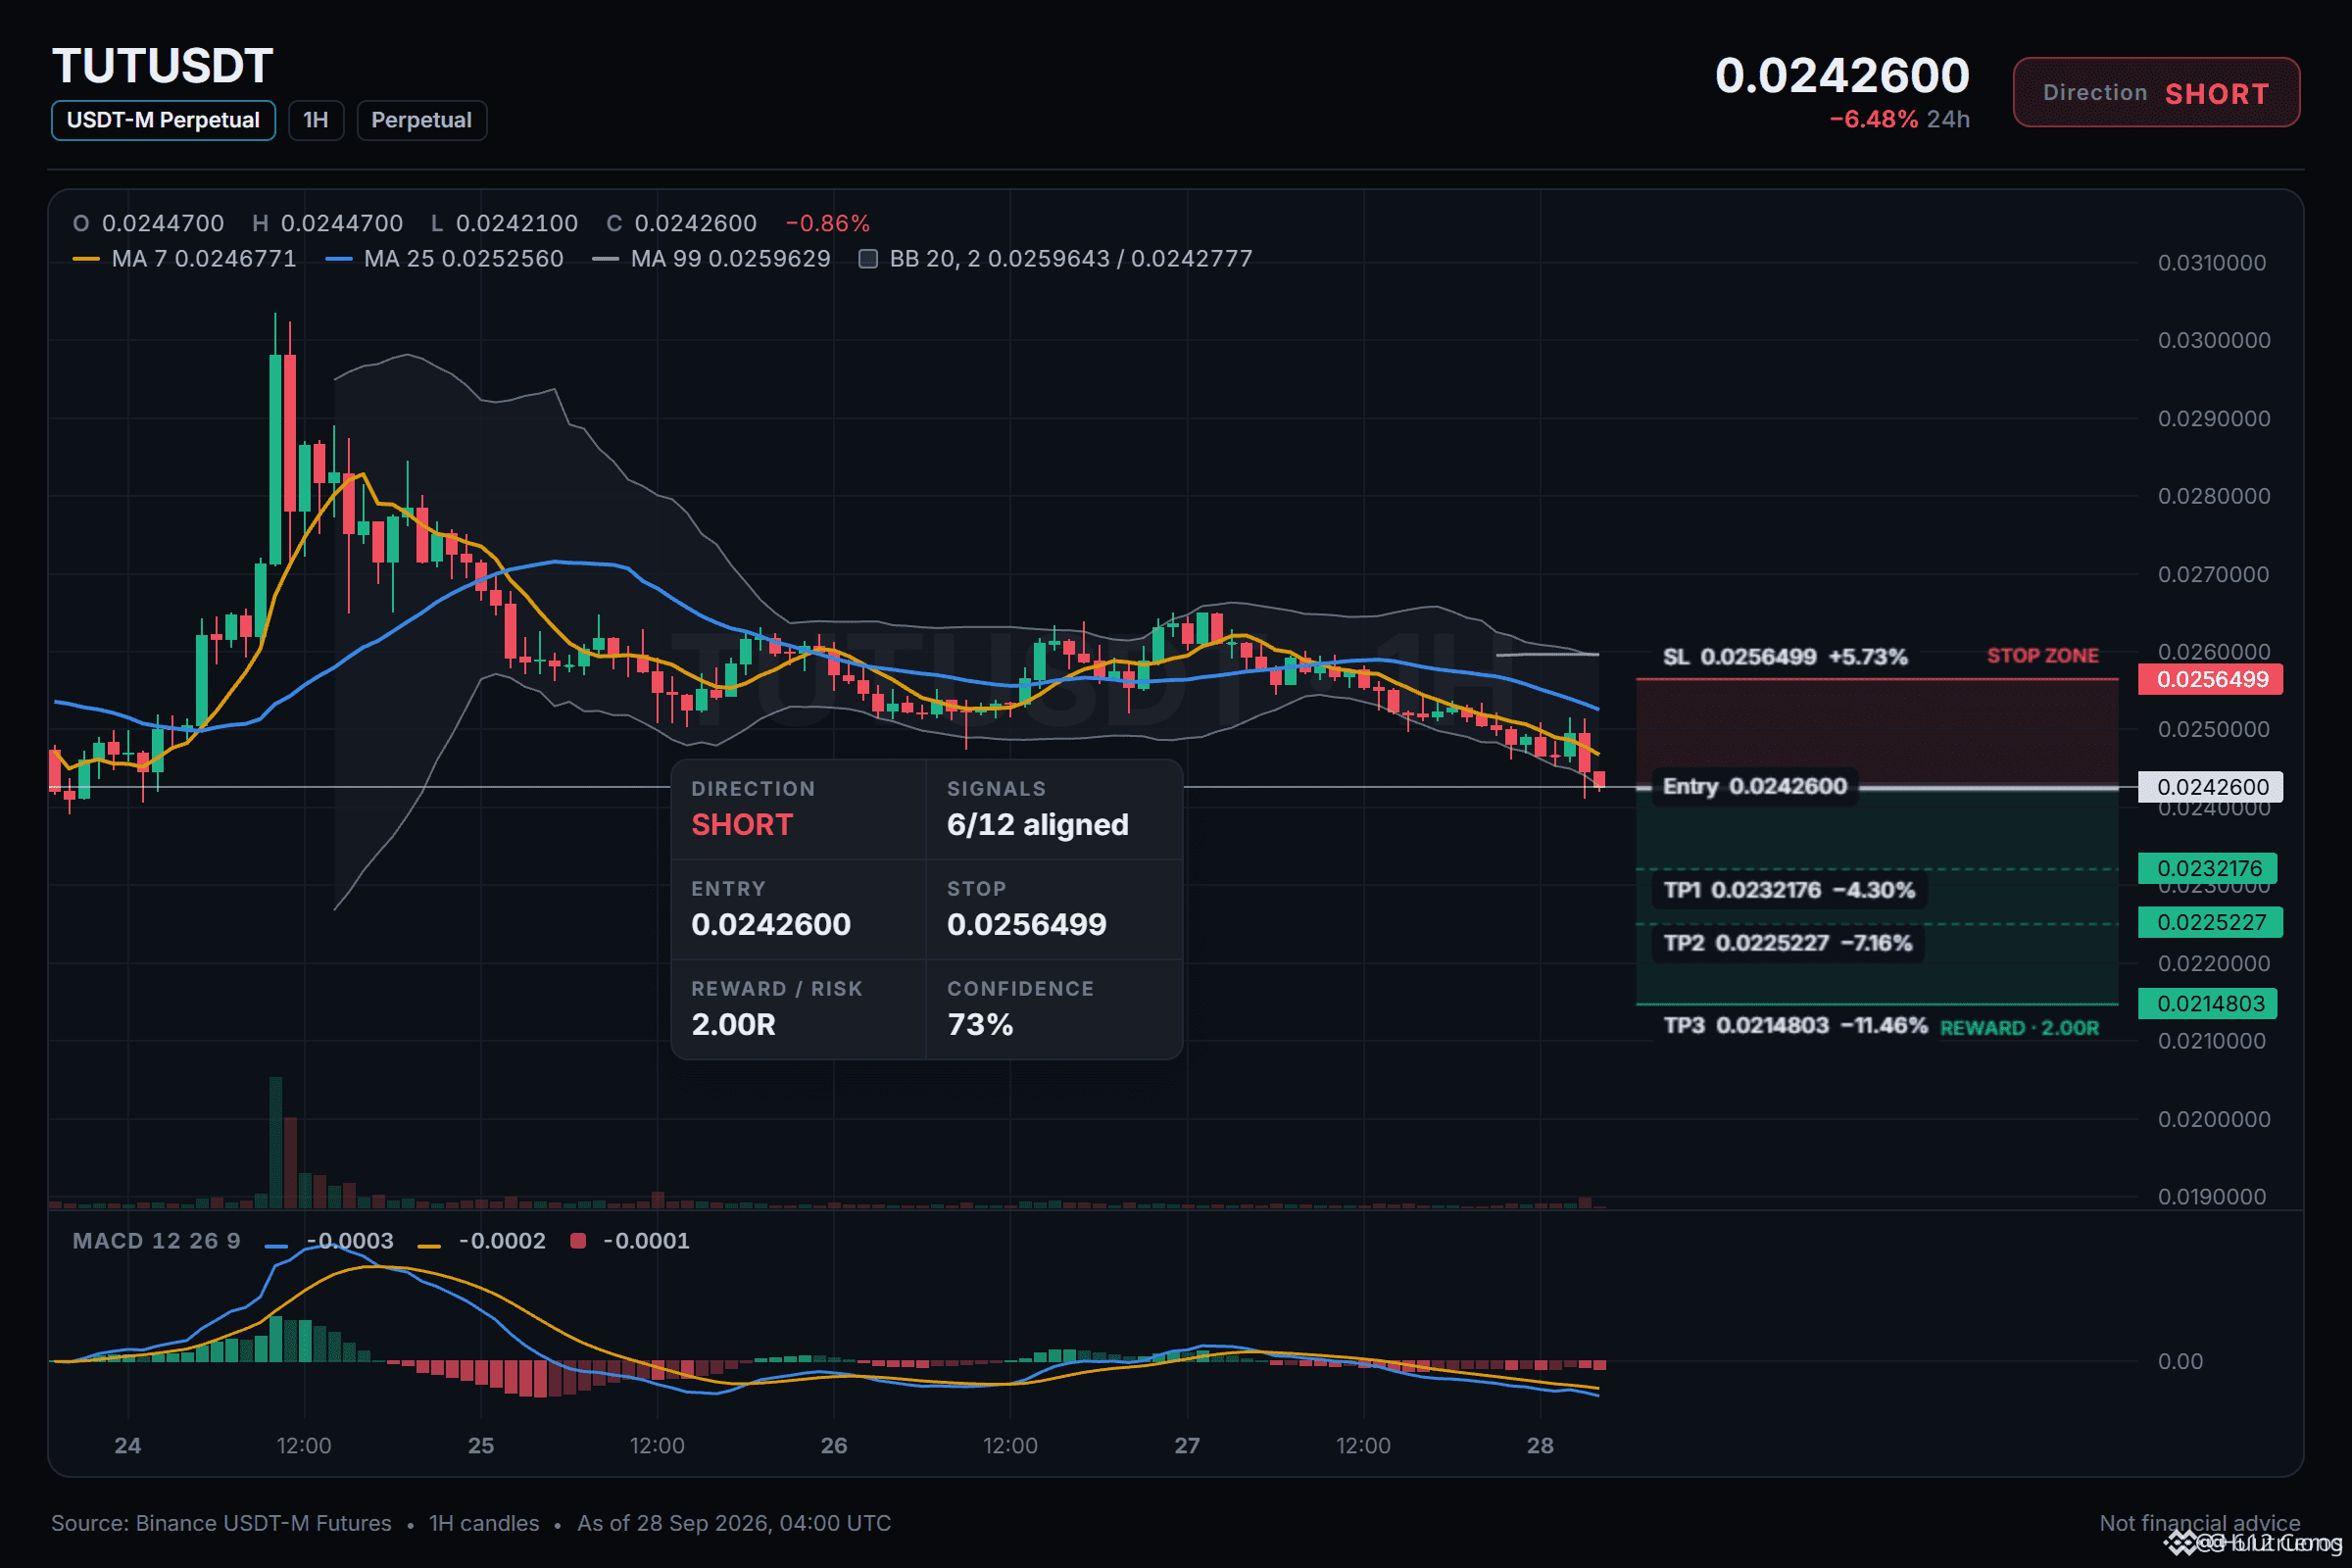
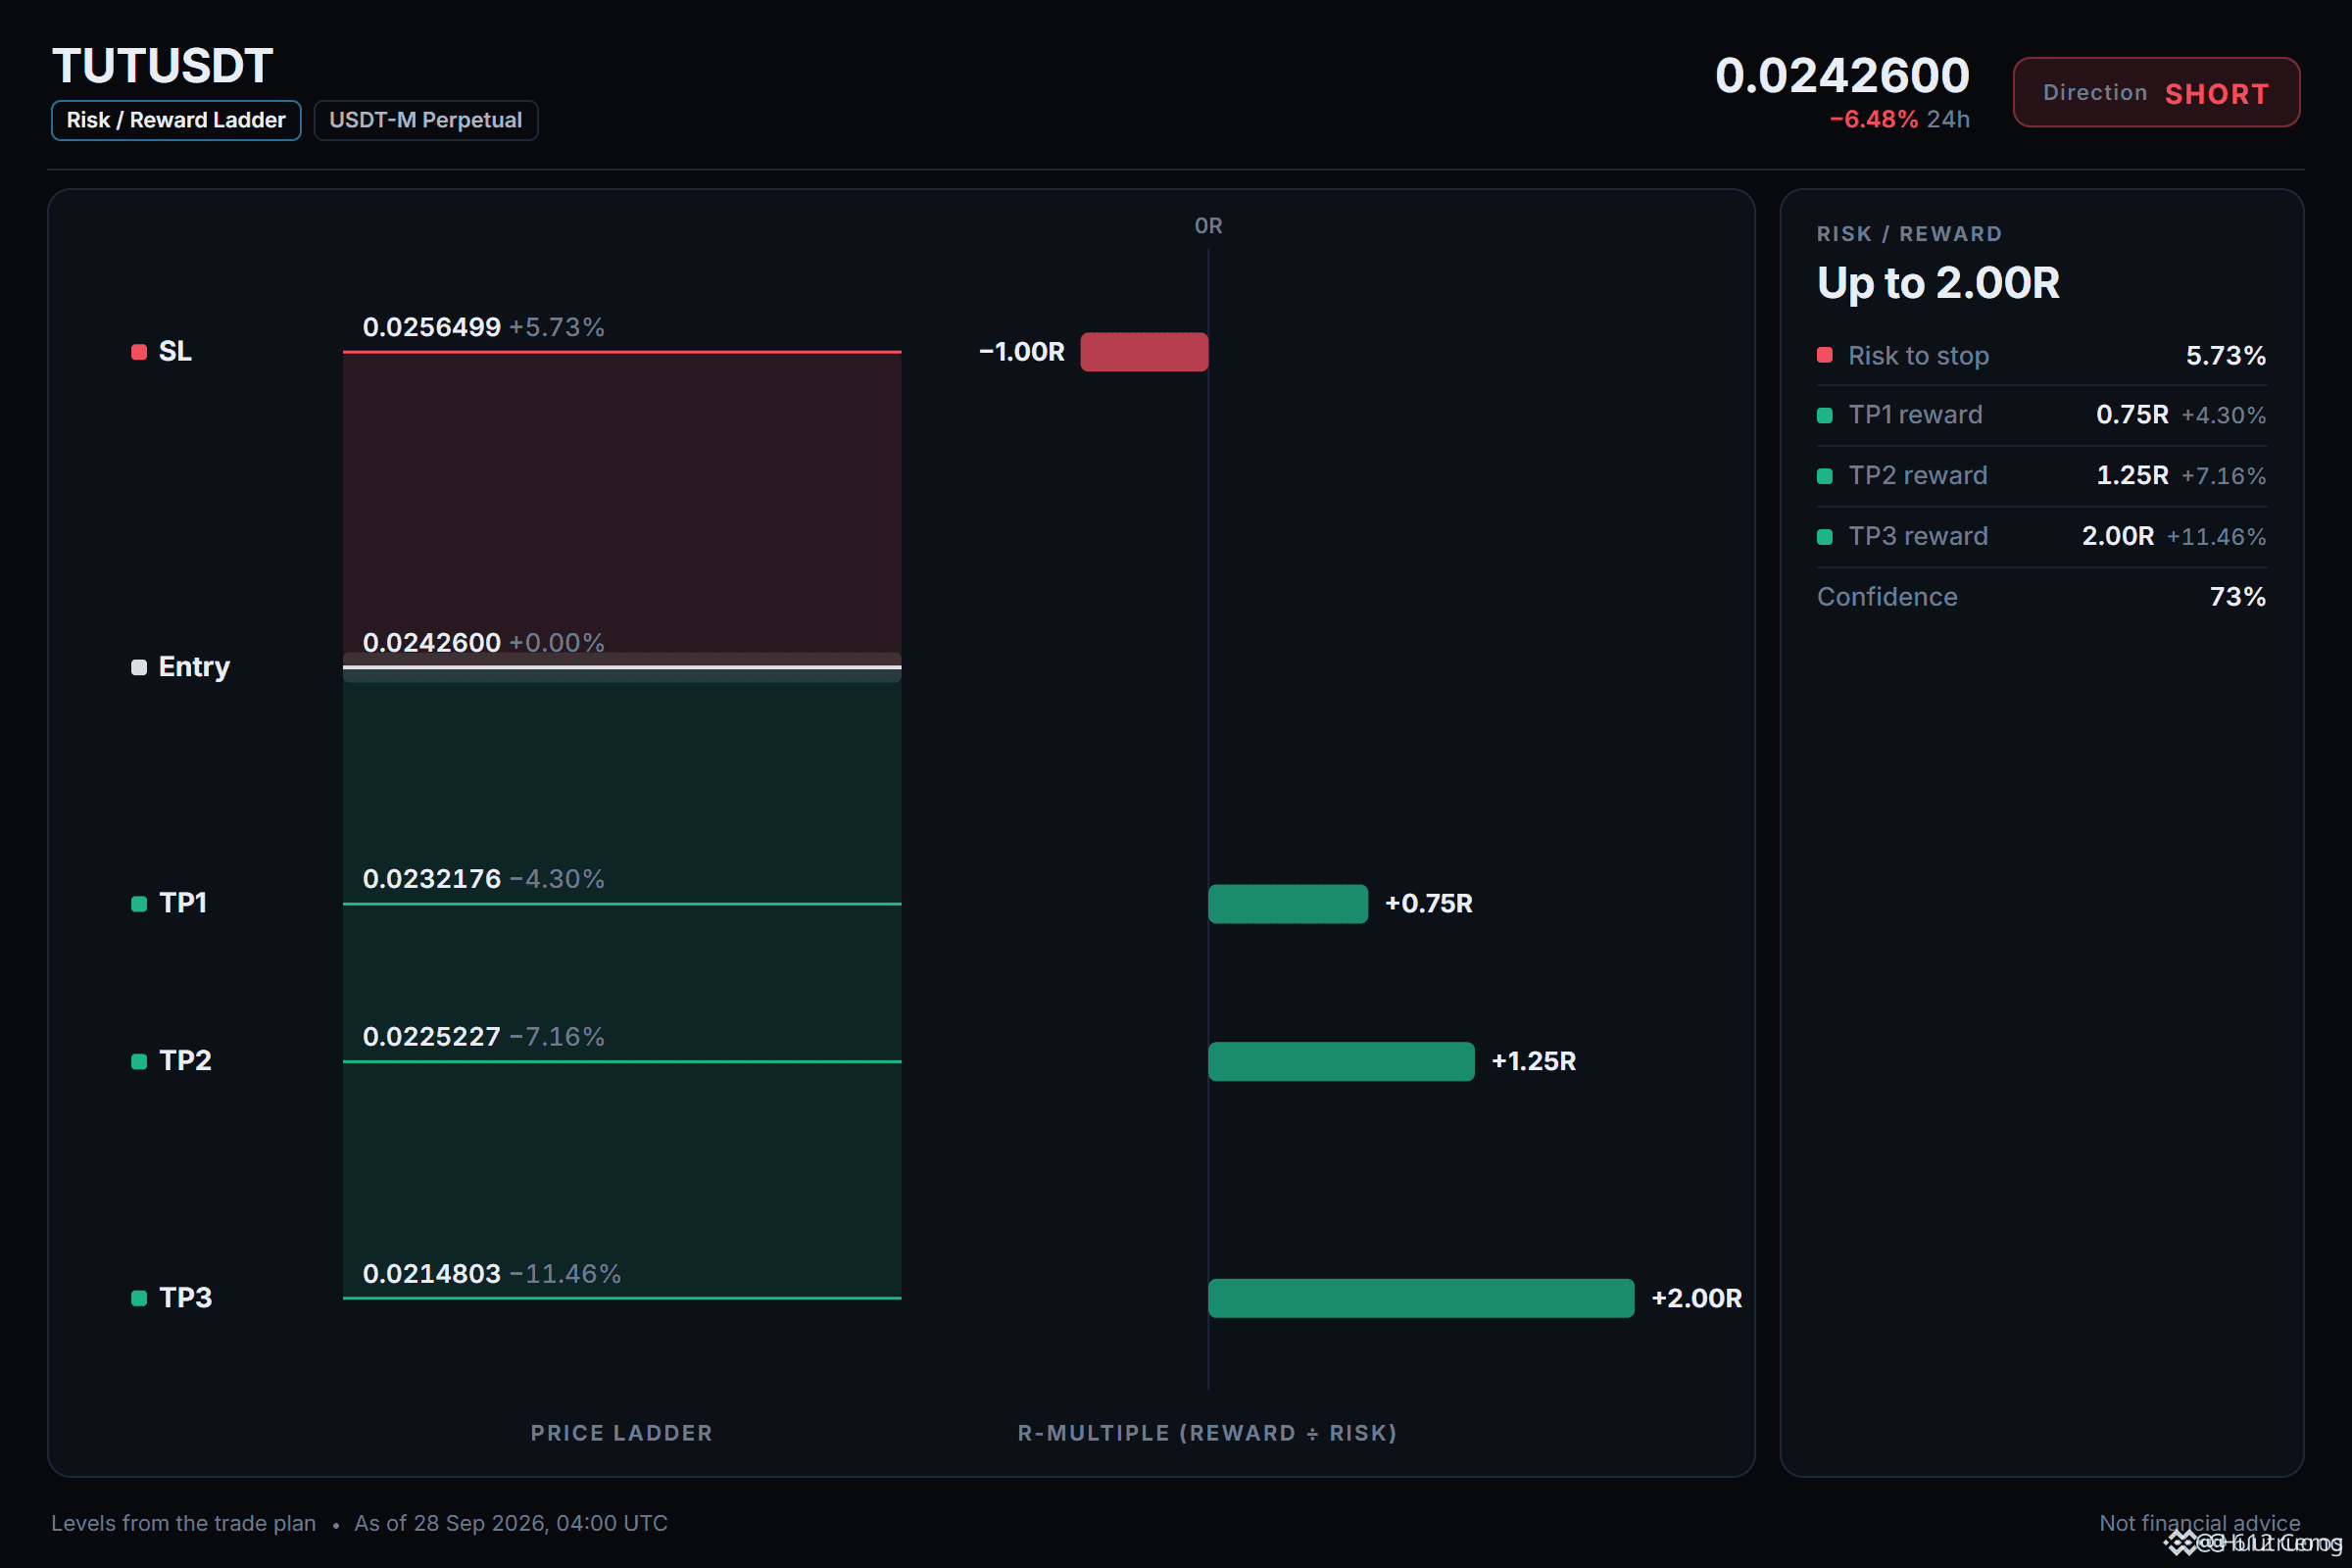
Map of levels:
🛑 SL: 0.0256499
📍 Entry: 0.0241932 – 0.0243268
🎯 TP1: 0.0232176
🎯 TP2: 0.0225227
🎯 TP3: 0.0214803
Now it’s your turn:
Do you see the daily range being firmly maintained, or are you expecting an upside breakout that would invalidate this setup?
All the setup on the chart 👇
📊 $TUT /USDT · Bias: SHORT (Strong) · 6/12 signals in agreement
I have checked: 6/12 signals in agreement
✅ 4h trend direction: price < EMA50 < EMA200, bearish stacking
✅ Trend strength (ADX/DI, 15m): ADX 29.6 with sellers in control (DI+ 11.1 vs DI− 29.8)
✅ BTC context: BTC trend is bearish and correlation is 0.61
✅ RSI 4h: 40.5, downward momentum (below 45)
✅ RSI 1h: 29.7, downward momentum (below 45)
⚠️ Invalidation: the thesis is wrong if it goes above 0.0251160
Conclusion: This setup strongly favors SHORT with a total of 6/12 signals. The strongest supporting factors are the 4h trend showing a falling EMA sequence, the 15m trend strength with ADX at 29.6 and DI− at 29.8, along with the BTC context indicating a bearish trend with correlation 0.61. The main opposing factor is that the daily timeframe trend is still in a mixed range zone; it’s not a clearly defined bearish structure yet.
Map of levels:
🛑 SL: 0.0256499
📍 Entry: 0.0241932 – 0.0243268
🎯 TP1: 0.0232176
🎯 TP2: 0.0225227
🎯 TP3: 0.0214803
Now it’s your turn:
Do you see the daily range being firmly maintained, or are you expecting an upside breakout that would invalidate this setup?
All the setup on the chart 👇