#SEI/USDT
🔍 Reading technical indicators
1. KDJ indicator (Momentum indicator)
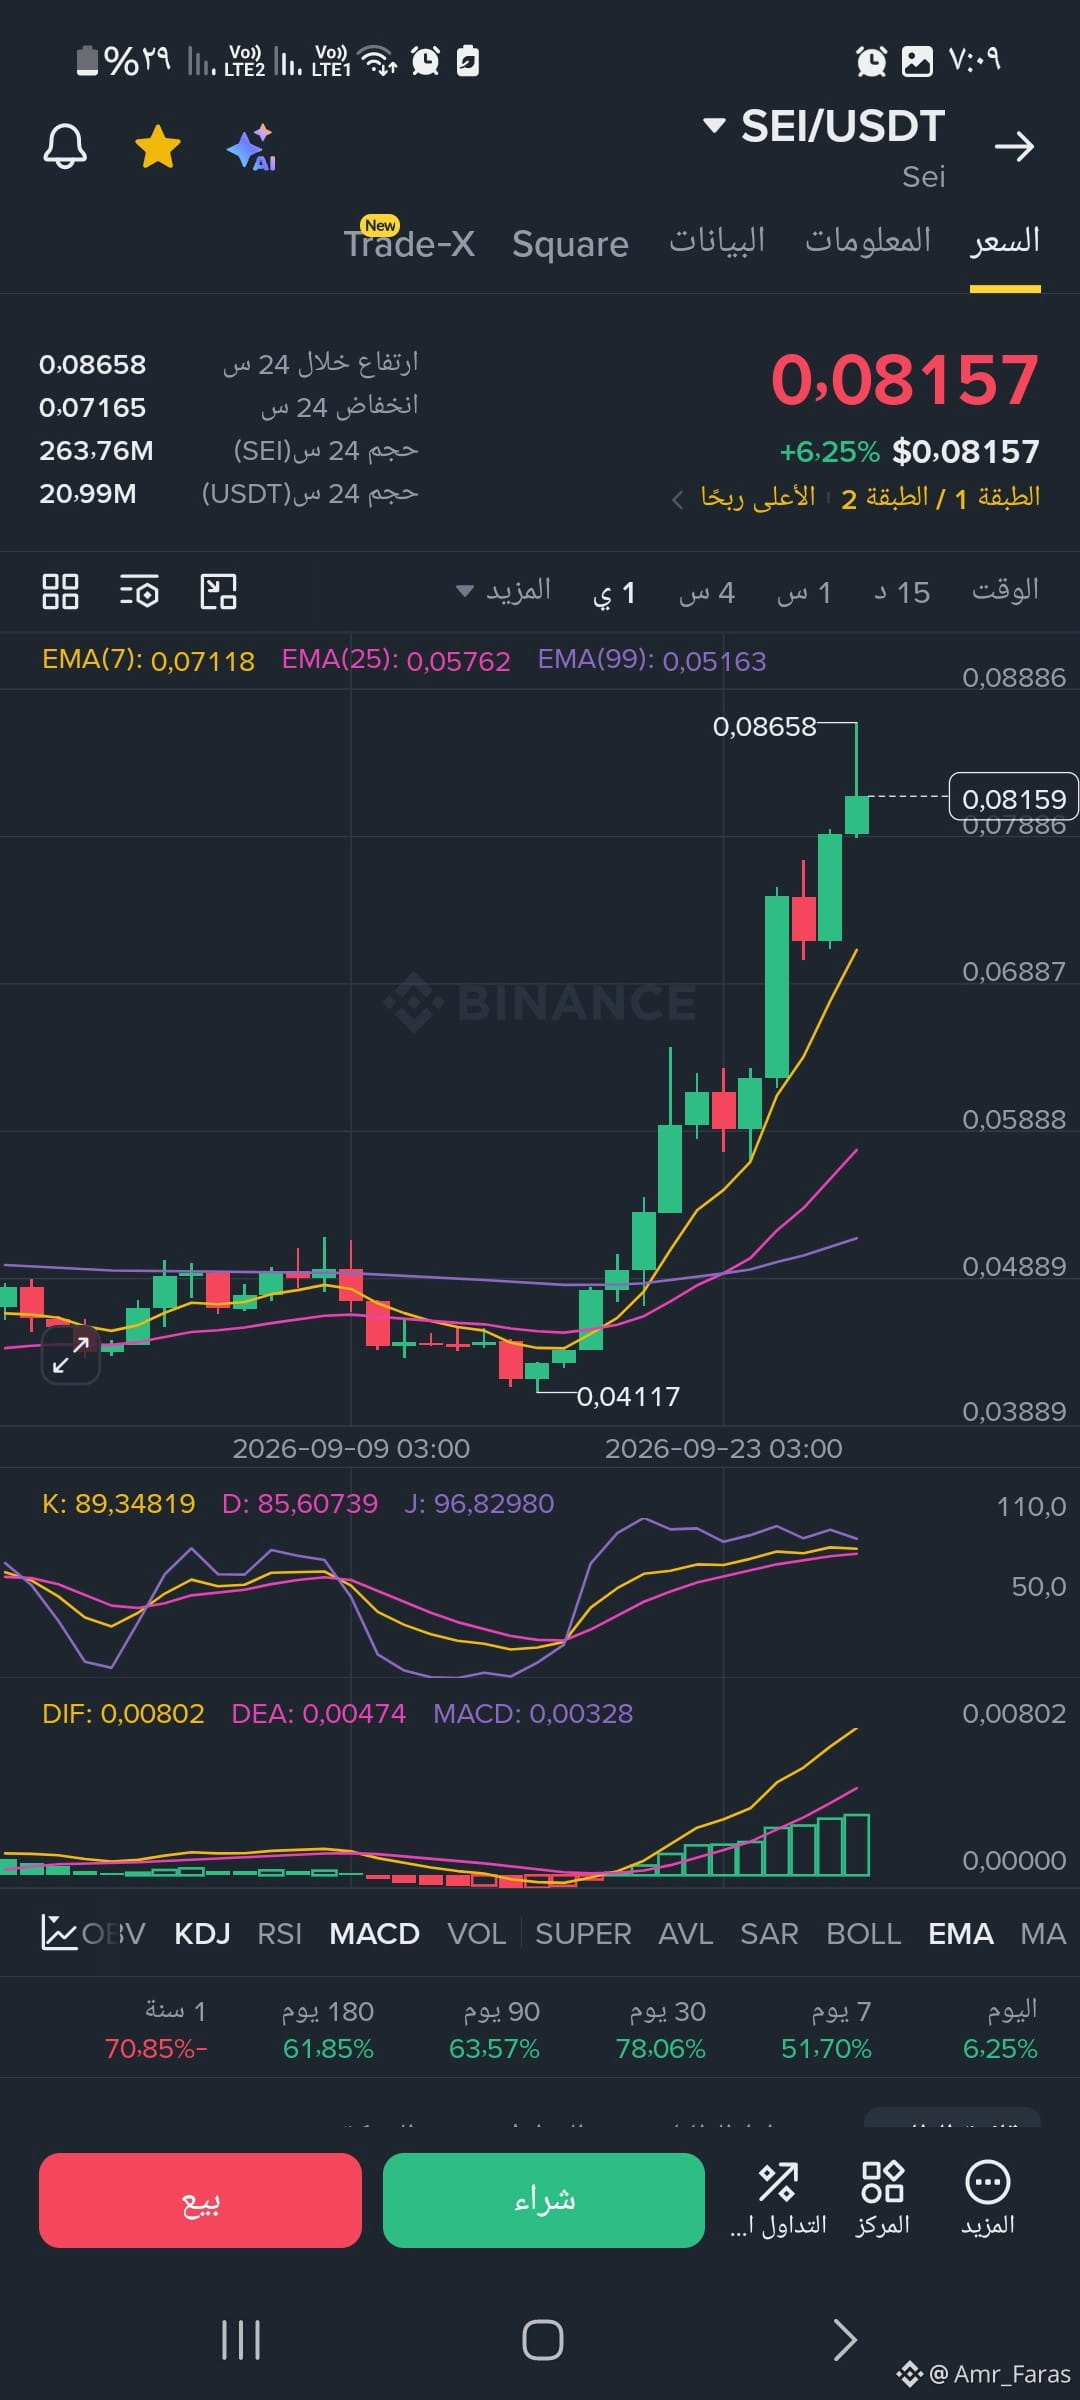
Current values: K: 89.34 | D: 85.60 | J: 96.82
Analysis: The lines are clearly trading in the Overbought zone above the 80 levels. The lines are close together and moving in parallel upward, reflecting the continued strength of upward momentum. However, entering at these levels involves high risk due to the likelihood of a near-term correction.
2. MACD indicator (MACD)
Analysis: The histogram bars are green and expanding in the positive zone above the zero line. The DIF line (0.00802) is above the DEA line (0.00407), confirming the ongoing positive crossover and the current strength of the upward momentum.
🔍 Reading technical indicators
1. KDJ indicator (Momentum indicator)
Current values: K: 89.34 | D: 85.60 | J: 96.82
Analysis: The lines are clearly trading in the Overbought zone above the 80 levels. The lines are close together and moving in parallel upward, reflecting the continued strength of upward momentum. However, entering at these levels involves high risk due to the likelihood of a near-term correction.
2. MACD indicator (MACD)
Analysis: The histogram bars are green and expanding in the positive zone above the zero line. The DIF line (0.00802) is above the DEA line (0.00407), confirming the ongoing positive crossover and the current strength of the upward momentum.