

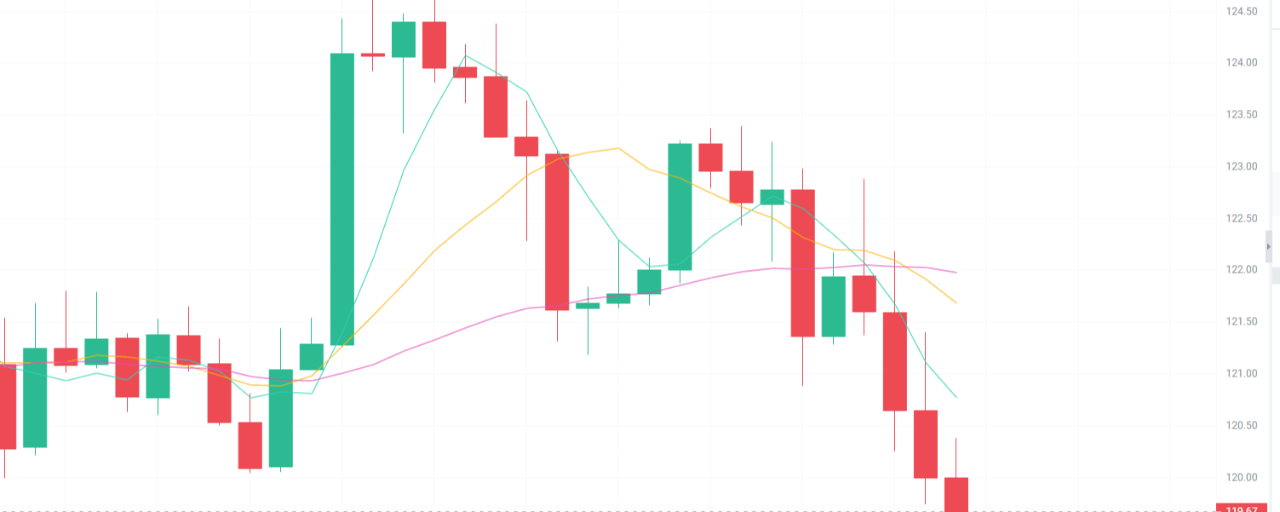

SOL's key level is set for a long-vs-short showdown: 119.7 could be the point where selling pressure eases—can today see a rebound and recovery?
Today is September 28, and SOL is trading at 119.70. Based on the candlestick structure, after a round of rapid sell-off, SOL has already reached a nearby important prior price area. In the short term, there has been a clear dip. At the same time, SOL’s recent market is indeed in a high-volatility phase, and the $120 level is also a zone that has been repeatedly contested recently.
From a trading perspective, the most important thing right now isn’t guessing the top or the bottom—it’s watching whether the $119–$120 range can form a reliable support. Today, I’m leaning toward first looking for a rebound and recovery, with long positions only under the premise of a strict stop-loss.
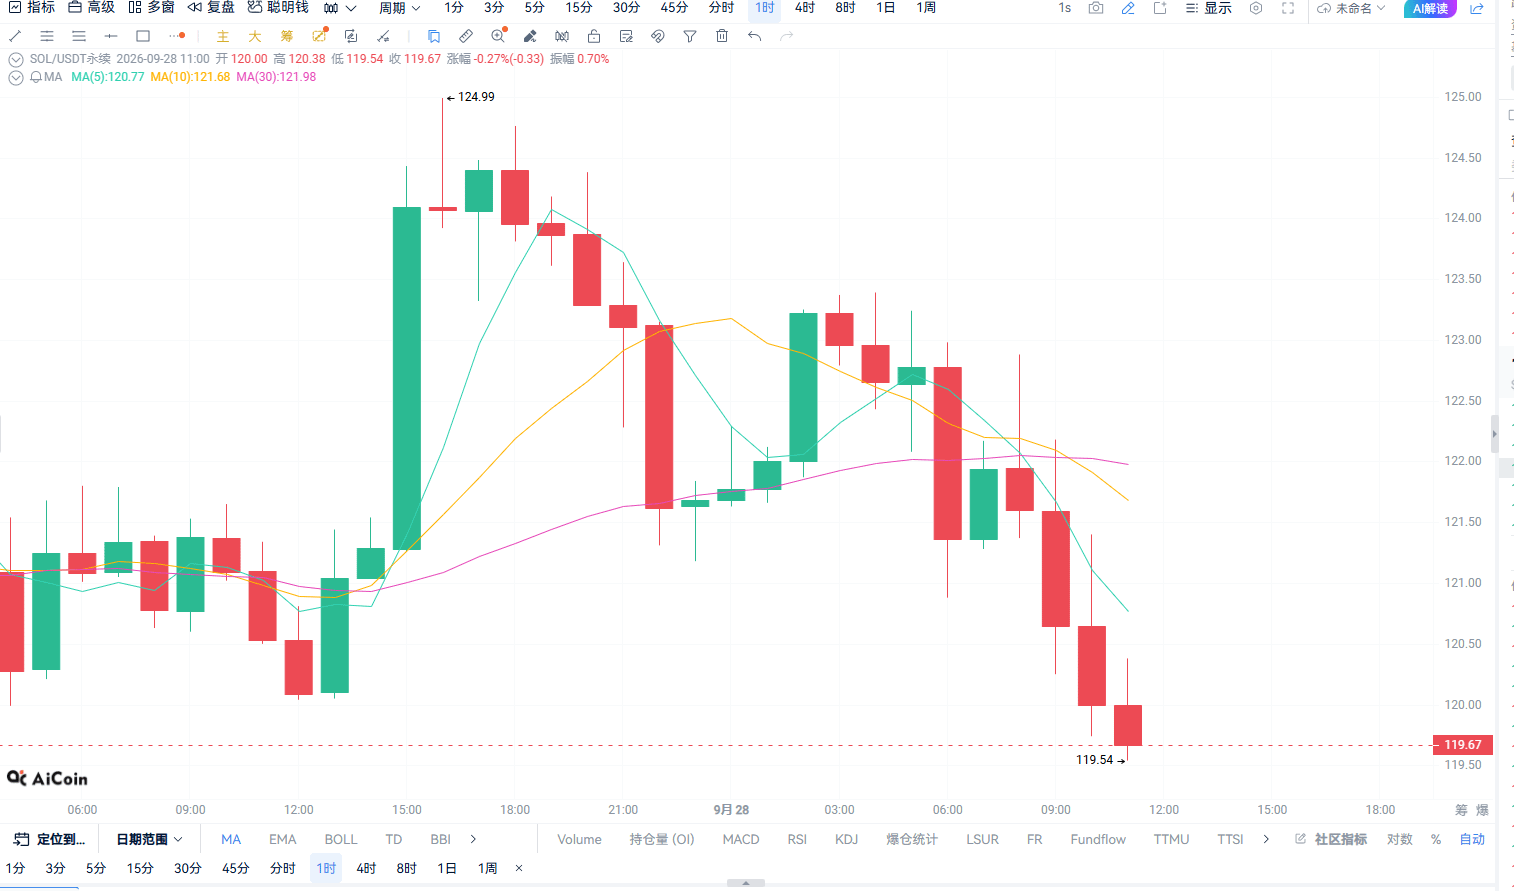
1-hour chart: After the sharp selloff, there is a need for short-term stabilization/stop-the-fall.
From the 1-hour K-line chart: SOL formed a local high around 124.99 earlier. After that, the price kept falling, the moving-average system clearly started turning downward, and the short-cycle MAs have been suppressing price action.
Currently the price is around 119.70. During the session, the low already dipped to 119.54, suggesting that there is some support/consolidation near 119.5.
But here you can’t simply understand it as already reversed. What you truly need to focus on in the short term is the 120.50–121.00 area. If the price can stand back above that zone, it indicates that the rebound strength after the sharp drop is increasing. Otherwise, if 119.50 is lost, there’s still a possibility for the short term to continue searching for support.
So my view on the 1-hour timeframe is:
Sharp drop → near support → attempt to repair/rebound.
You can go long in the short term, but you must put risk control first.
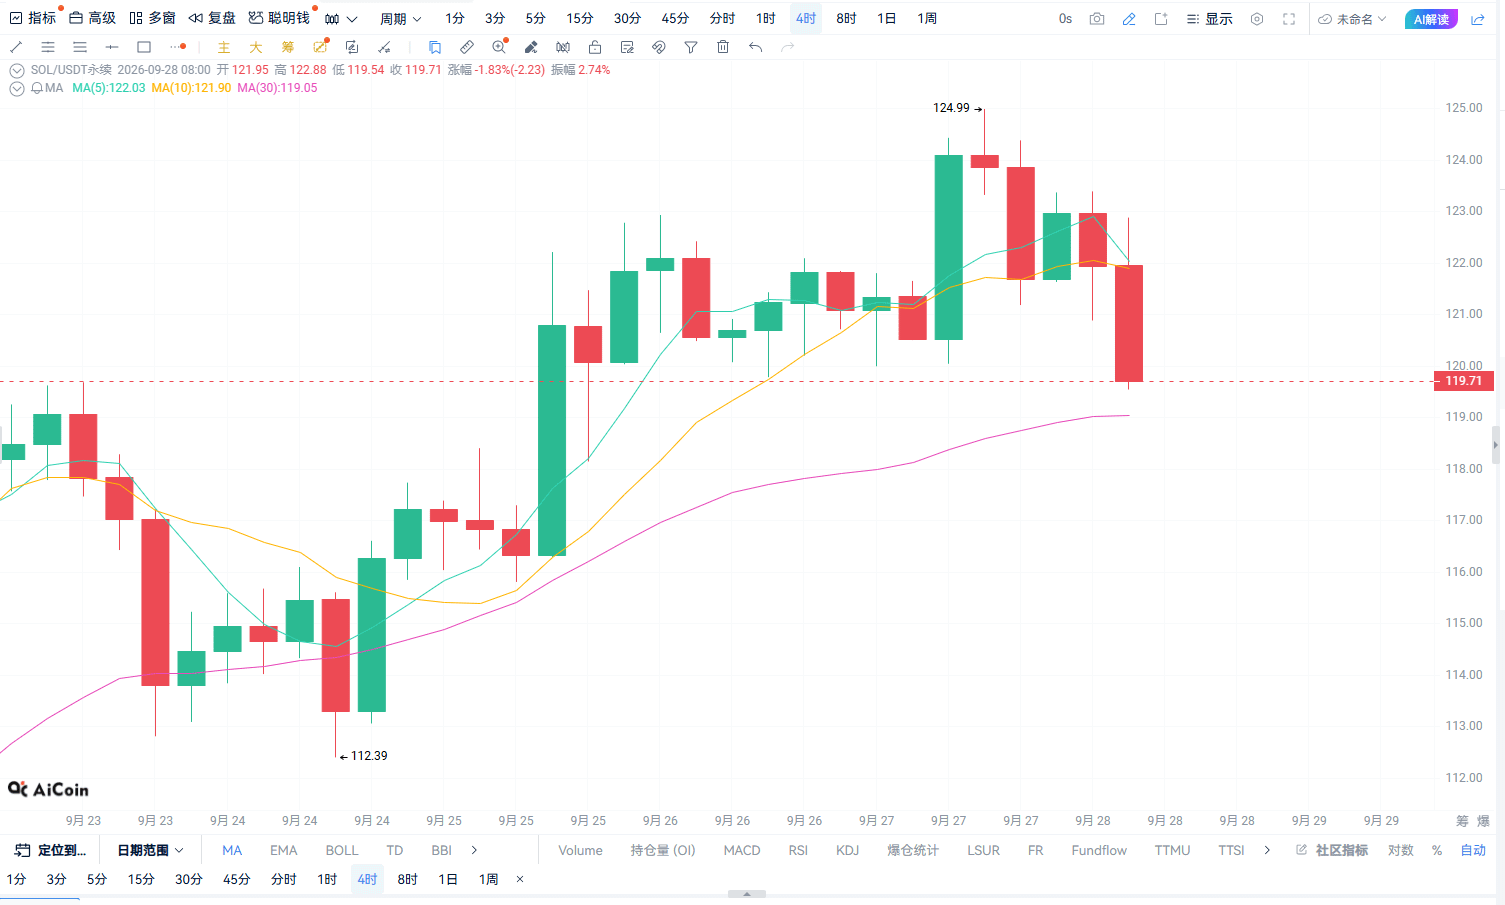
4-hour chart: The trend hasn’t fully broken down, but the strength of the short-term pullback is relatively strong.
On the 4-hour timeframe: SOL bounced all the way from the lows earlier, then showed a clear spike-and-retrace at higher levels. Now the price has moved back to the earlier ranging zone.
This kind of走势 indicates that the mid-to-short cycle is going through a fairly obvious switching/re-handing of longs and shorts.
The most critical area right now is still the 119–120 dollar zone. As long as this area can hold, there will still be room for a rebound pullback toward 121.5–123 dollars.
But if, on the 4-hour timeframe, there are consecutive closes below 119 dollars, the bulls’ structure will face additional pressure. At that point, you can’t simply define the current move as a normal retracement.
So on the 4-hour timeframe, my thinking is very clear:
Look for a rebound and repair above 119 dollars. If the key support breaks, cut losses in time—don’t hold onto it stubbornly.
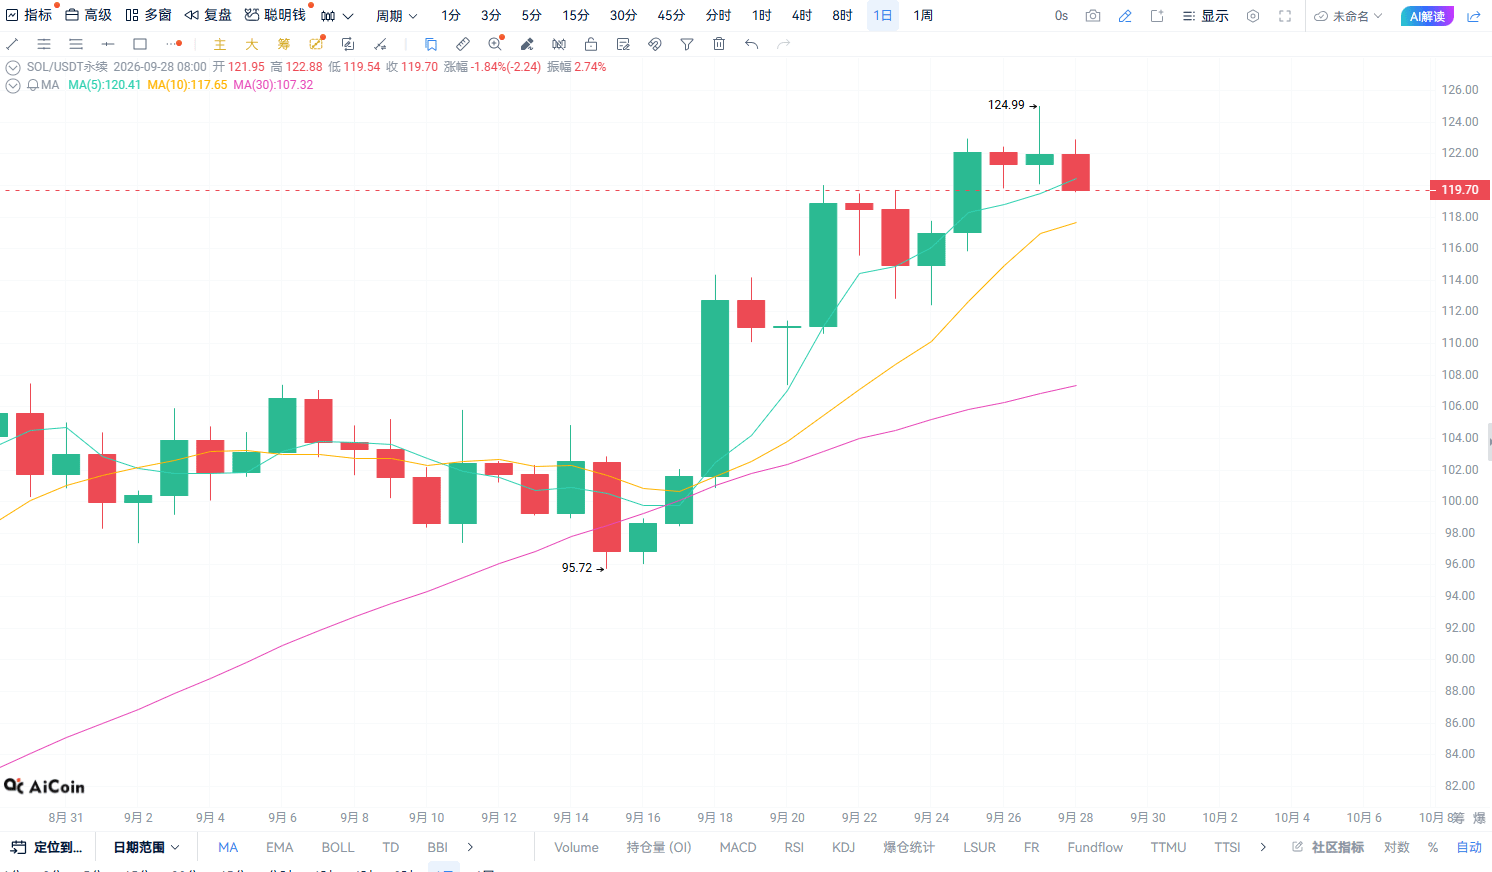
Daily chart: The bigger trend is still in the repair phase, and what we’re seeing now is a key pullback.
On the daily timeframe, SOL has already gone through a fairly noticeable rebound from the lows. Recently, the highest touched 124.99, which shows that the bulls have already regained some initiative.
But after the spike upward, there was a quick pullback—this indicates that selling pressure above is still present.
Currently it has moved back to around 120 dollars. On the daily chart, this is more like an important pullback confirmation. As long as the subsequent price can hold around 119 dollars and then reclaim the 121–122 dollar zone, the daily structure still has the possibility to repair further.
On the other hand, if the 119 dollar support is completely broken, the level of this pullback will expand significantly, and below, you’ll need to find new support again.
So for now, on the daily chart, don’t chase highs. Focus on whether support is effective, and wait for the price to regain initiative.
Trading approach for today
Putting together the 1-hour, 4-hour, and daily chart structure:
For short-term trades, first look at the strength of support/consolidation in the 119–120 dollar area. Right now, it’s more suitable for betting on an oversold rebound, not for blindly chasing short positions.
Focus on the upper area:
120.90 → 122.10 → 123.00
Focus on the lower area:
119.50 → 119.00
What you most want to avoid in trading is chasing shorts emotionally after seeing continuous price declines. And you also shouldn’t blindly bottom-pick just because the price has fallen a lot. The logic for going long right now is based on the 119 dollar support being effective. Once that support fails, you must strictly follow risk control.
🔥 Live trade | SOL price opens the position directly
Direction: Long
Entry price: 119.70
Stop-loss: 117.90
First take-profit: 120.90
Second take-profit: 122.09
Risk control: After reaching the first take-profit, remember to protect profits. If the 119 dollar support breaks, exit in time.
In one sentence: 119 dollars is today’s defense line for the bulls. Hold it to look for a rebound; if it breaks, retreat. Trading is not afraid of being wrong—what’s scary is holding a losing position.