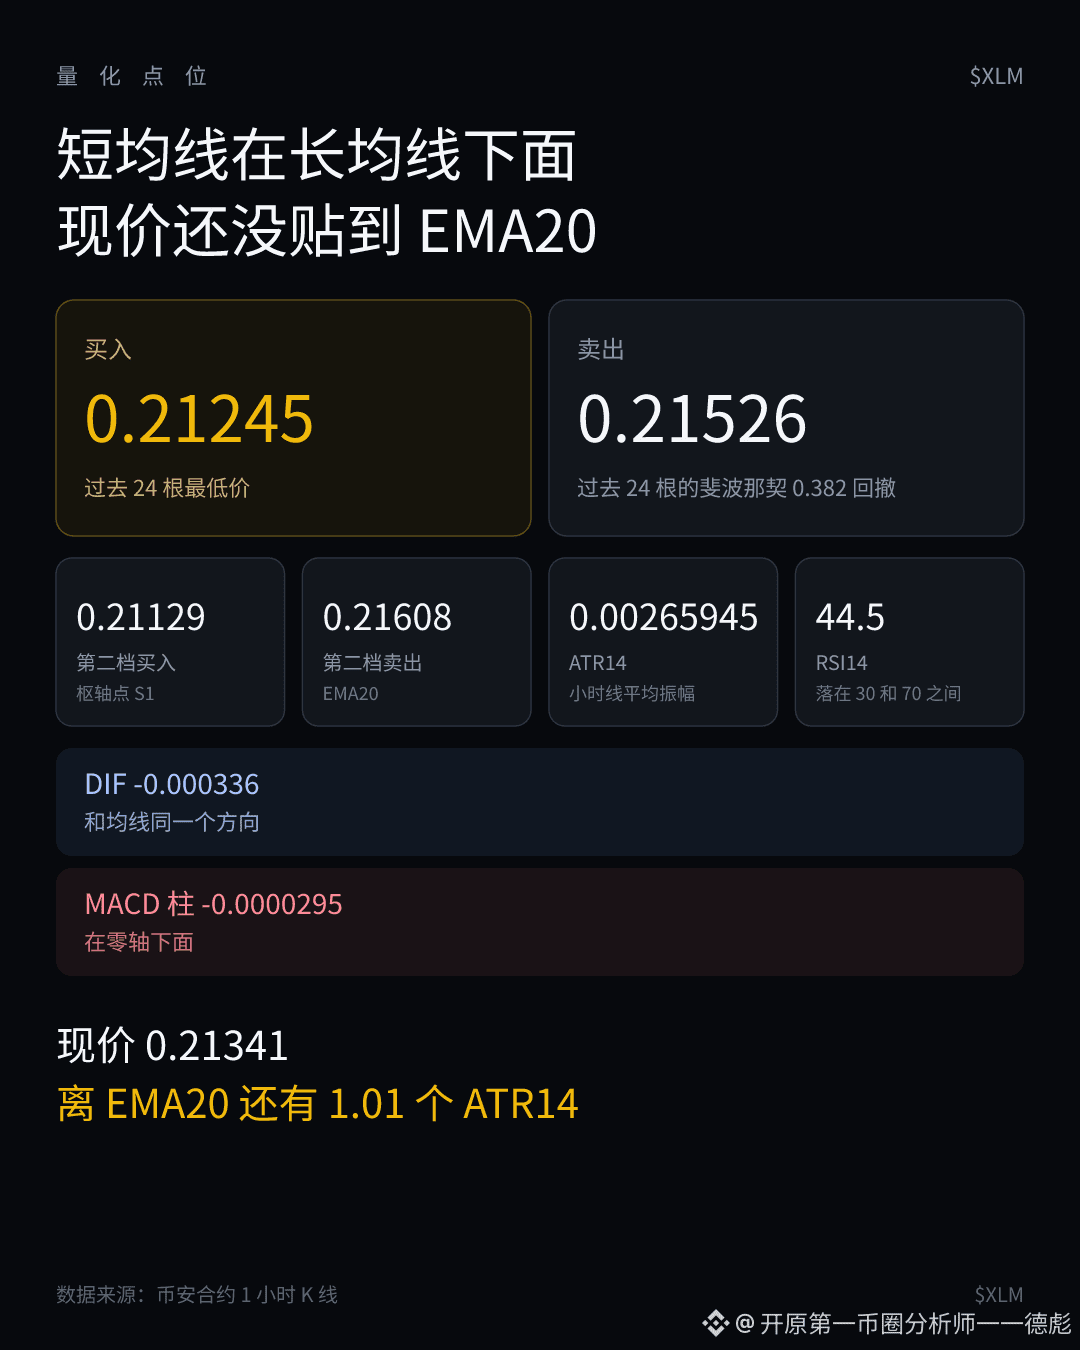
$XLM current price 0.21341, bearish.
- Sell 0.21526
- Sell 0.21608
- Buy 0.21245
- Buy 0.21129
Moving averages. The short moving average is below the long moving average; the current price is still 1.01 ATR14 away from the EMA20 and has not yet touched it.
The nearest buy is the lowest price of the past 24 hourly candles; the next buy level is pivot point S1.
The nearest sell is the Fibonacci 0.382 retracement of the past 24 hourly candles; the farther sell is the EMA20.
The long moving average EMA60 is at 0.21714, still above the two sell levels.
Momentum. Same direction as the moving averages. MACD DIF -0.000336 is below the zero axis. The histogram is -0.0000295, also below the zero axis, and has not turned stronger yet.
Volatility. The average swing of these hourly candles is ATR14 0.00265945. Both the most recent buy and sell are still within this volatility range.
#XLM
- Sell 0.21526
- Sell 0.21608
- Buy 0.21245
- Buy 0.21129
Moving averages. The short moving average is below the long moving average; the current price is still 1.01 ATR14 away from the EMA20 and has not yet touched it.
The nearest buy is the lowest price of the past 24 hourly candles; the next buy level is pivot point S1.
The nearest sell is the Fibonacci 0.382 retracement of the past 24 hourly candles; the farther sell is the EMA20.
The long moving average EMA60 is at 0.21714, still above the two sell levels.
Momentum. Same direction as the moving averages. MACD DIF -0.000336 is below the zero axis. The histogram is -0.0000295, also below the zero axis, and has not turned stronger yet.
Volatility. The average swing of these hourly candles is ATR14 0.00265945. Both the most recent buy and sell are still within this volatility range.
#XLM