🚨 $ETH Update: Liquidity Pullback, Confirm the Downtrend! 🚨
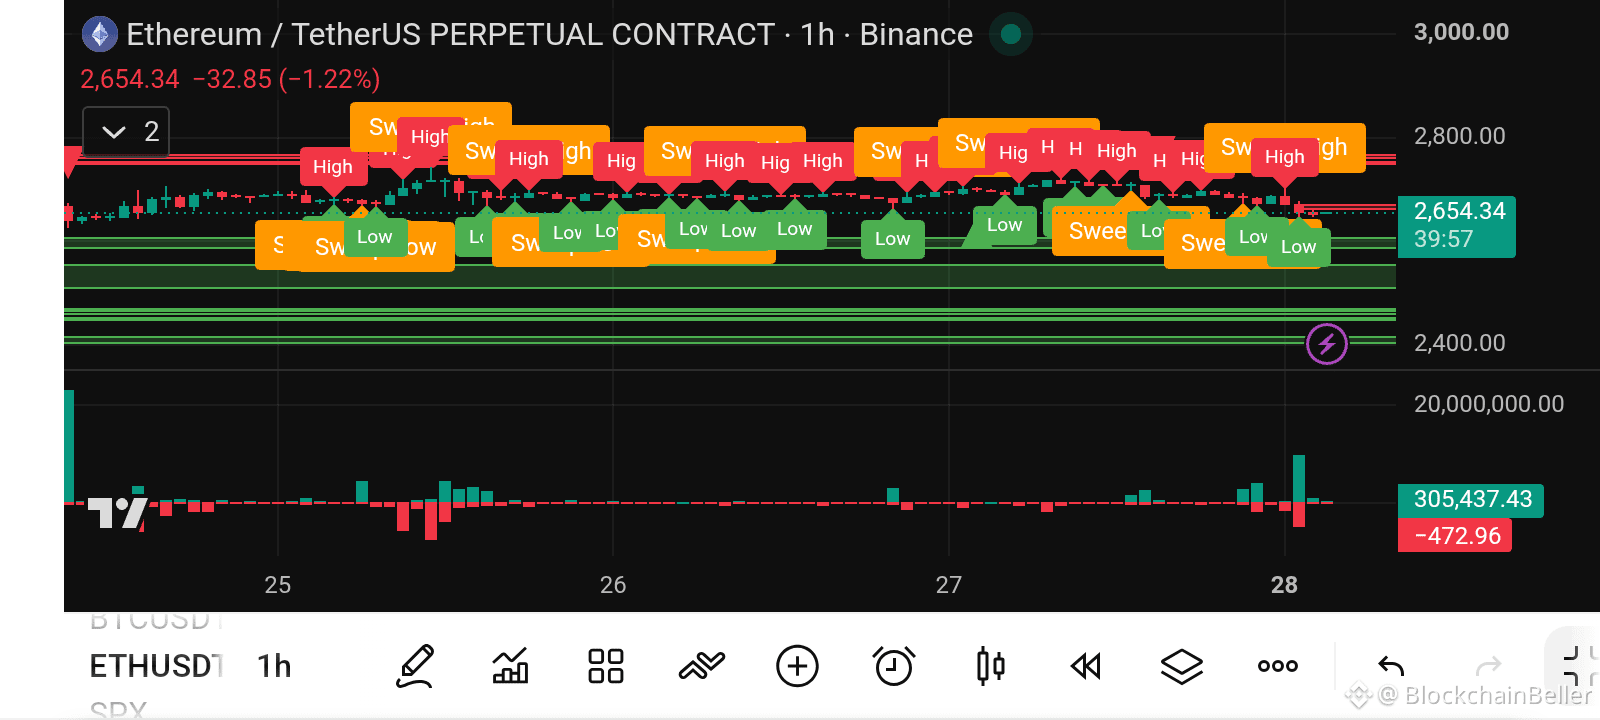
On the watch’s time frame, $ETH shows a clear shift in behavior. The price aggressively pulled buy-side liquidity around the 2,800 level before facing a sharp rejection. This move trapped breakout buyers and triggered a bearish transition in the market structure.
📉 After the rejection, $ETH dropped sharply, pulling sell-side liquidity near the 2,650 level. The price is currently trading below all the main moving averages (MA7, MA25, and MA99), which are now acting as dynamic resistance. The negative volume delta at the bottom of the chart confirms aggressive selling pressure.
🔍 Key Levels:
• Immediate resistance is the 2,680 – 2,700 zone (the previous support turned into resistance).
• The latest bottom at 2,626 is the target for immediate liquidity (sell-side liquidity).
🎯 Trading Plan: Sell $ETH on a Retest
We’re looking for continued downside. Don’t chase the current rebound; wait for the price to return to test the supply zone.
• Entry zone: 2,675 – 2,690
• Stop loss: 2,730 (above the last rejection high)
• Take profit 1: 2,620 (the last liquidity low)
• Take profit 2: 2,580
• Take profit 3: 2,520
⚠️ Confirmation Needed:
Wait for a clear bearish rejection candle (such as a shooting star, a bearish engulfing, or a long upper wick) on the 1-hour time frame within the entry zone before executing.
❌ Trade Invalidation:
A strong 1-hour candle close above 2,730 invalidates this sell setup and signals a deeper correction upward.
Protect your capital, manage your risk, and let the price come to you. 📉
On the watch’s time frame, $ETH shows a clear shift in behavior. The price aggressively pulled buy-side liquidity around the 2,800 level before facing a sharp rejection. This move trapped breakout buyers and triggered a bearish transition in the market structure.
📉 After the rejection, $ETH dropped sharply, pulling sell-side liquidity near the 2,650 level. The price is currently trading below all the main moving averages (MA7, MA25, and MA99), which are now acting as dynamic resistance. The negative volume delta at the bottom of the chart confirms aggressive selling pressure.
🔍 Key Levels:
• Immediate resistance is the 2,680 – 2,700 zone (the previous support turned into resistance).
• The latest bottom at 2,626 is the target for immediate liquidity (sell-side liquidity).
🎯 Trading Plan: Sell $ETH on a Retest
We’re looking for continued downside. Don’t chase the current rebound; wait for the price to return to test the supply zone.
• Entry zone: 2,675 – 2,690
• Stop loss: 2,730 (above the last rejection high)
• Take profit 1: 2,620 (the last liquidity low)
• Take profit 2: 2,580
• Take profit 3: 2,520
⚠️ Confirmation Needed:
Wait for a clear bearish rejection candle (such as a shooting star, a bearish engulfing, or a long upper wick) on the 1-hour time frame within the entry zone before executing.
❌ Trade Invalidation:
A strong 1-hour candle close above 2,730 invalidates this sell setup and signals a deeper correction upward.
Protect your capital, manage your risk, and let the price come to you. 📉