

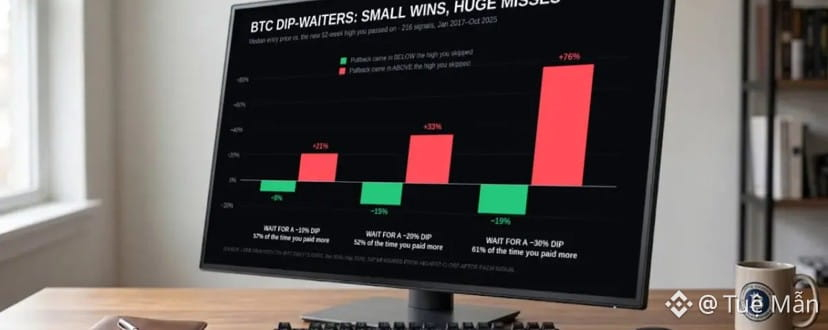



In most cases, people who buy Bitcoin when the price tests the 216 peak level have to pay more after a 30% decline than the previous peak. Waiting successfully yields a median discount of 19%; waiting unsuccessfully results in a median difference of 76%.
WHY THE DROP IN BITCOIN STILL LEADS TO HIGHER BUY PRICES
A Bitcoin investor may wait out a 30% drop but still end up paying a higher price than the one they initially passed up. That was the outcome in 61% of cases that Adam Livingston, Vice President for Investments at Strive Inc. (Nasdaq: ASST), a Bitcoin fund management firm, analyzed. In a post dated September 27 on X, he shared an analysis of the strategy for buying Bitcoin after price corrections. His test began with each of the 216 new 52-week highs from January 2017 to October 2025, then simulated waiting for the correction before buying.
The difference lies in when the drawdown starts. Bitcoin can rise far beyond the prior high before falling 30% from the peak that follows. In Livingston’s test, this drawdown took 134 days to occur (using the midpoint of the waiting window) and could last up to 881 days. The adjustment does happen, but the final buy price is usually higher than the initial opportunity.
Livingston illustrates this outcome with a starting price of $12,300 in August 2020. Under his 30% adjustment rule, the buy price that is modeled is $43,580—about 254% higher. This example reflects his main point: the magnitude of the drop from the subsequent peak does not, by itself, determine whether bitcoin has returned to the earlier price.
EVEN SMALLER DRAWDOWNS OF BITCOIN STILL OFTEN CANNOT SURPASS THE PRIOR PRICE LEVEL
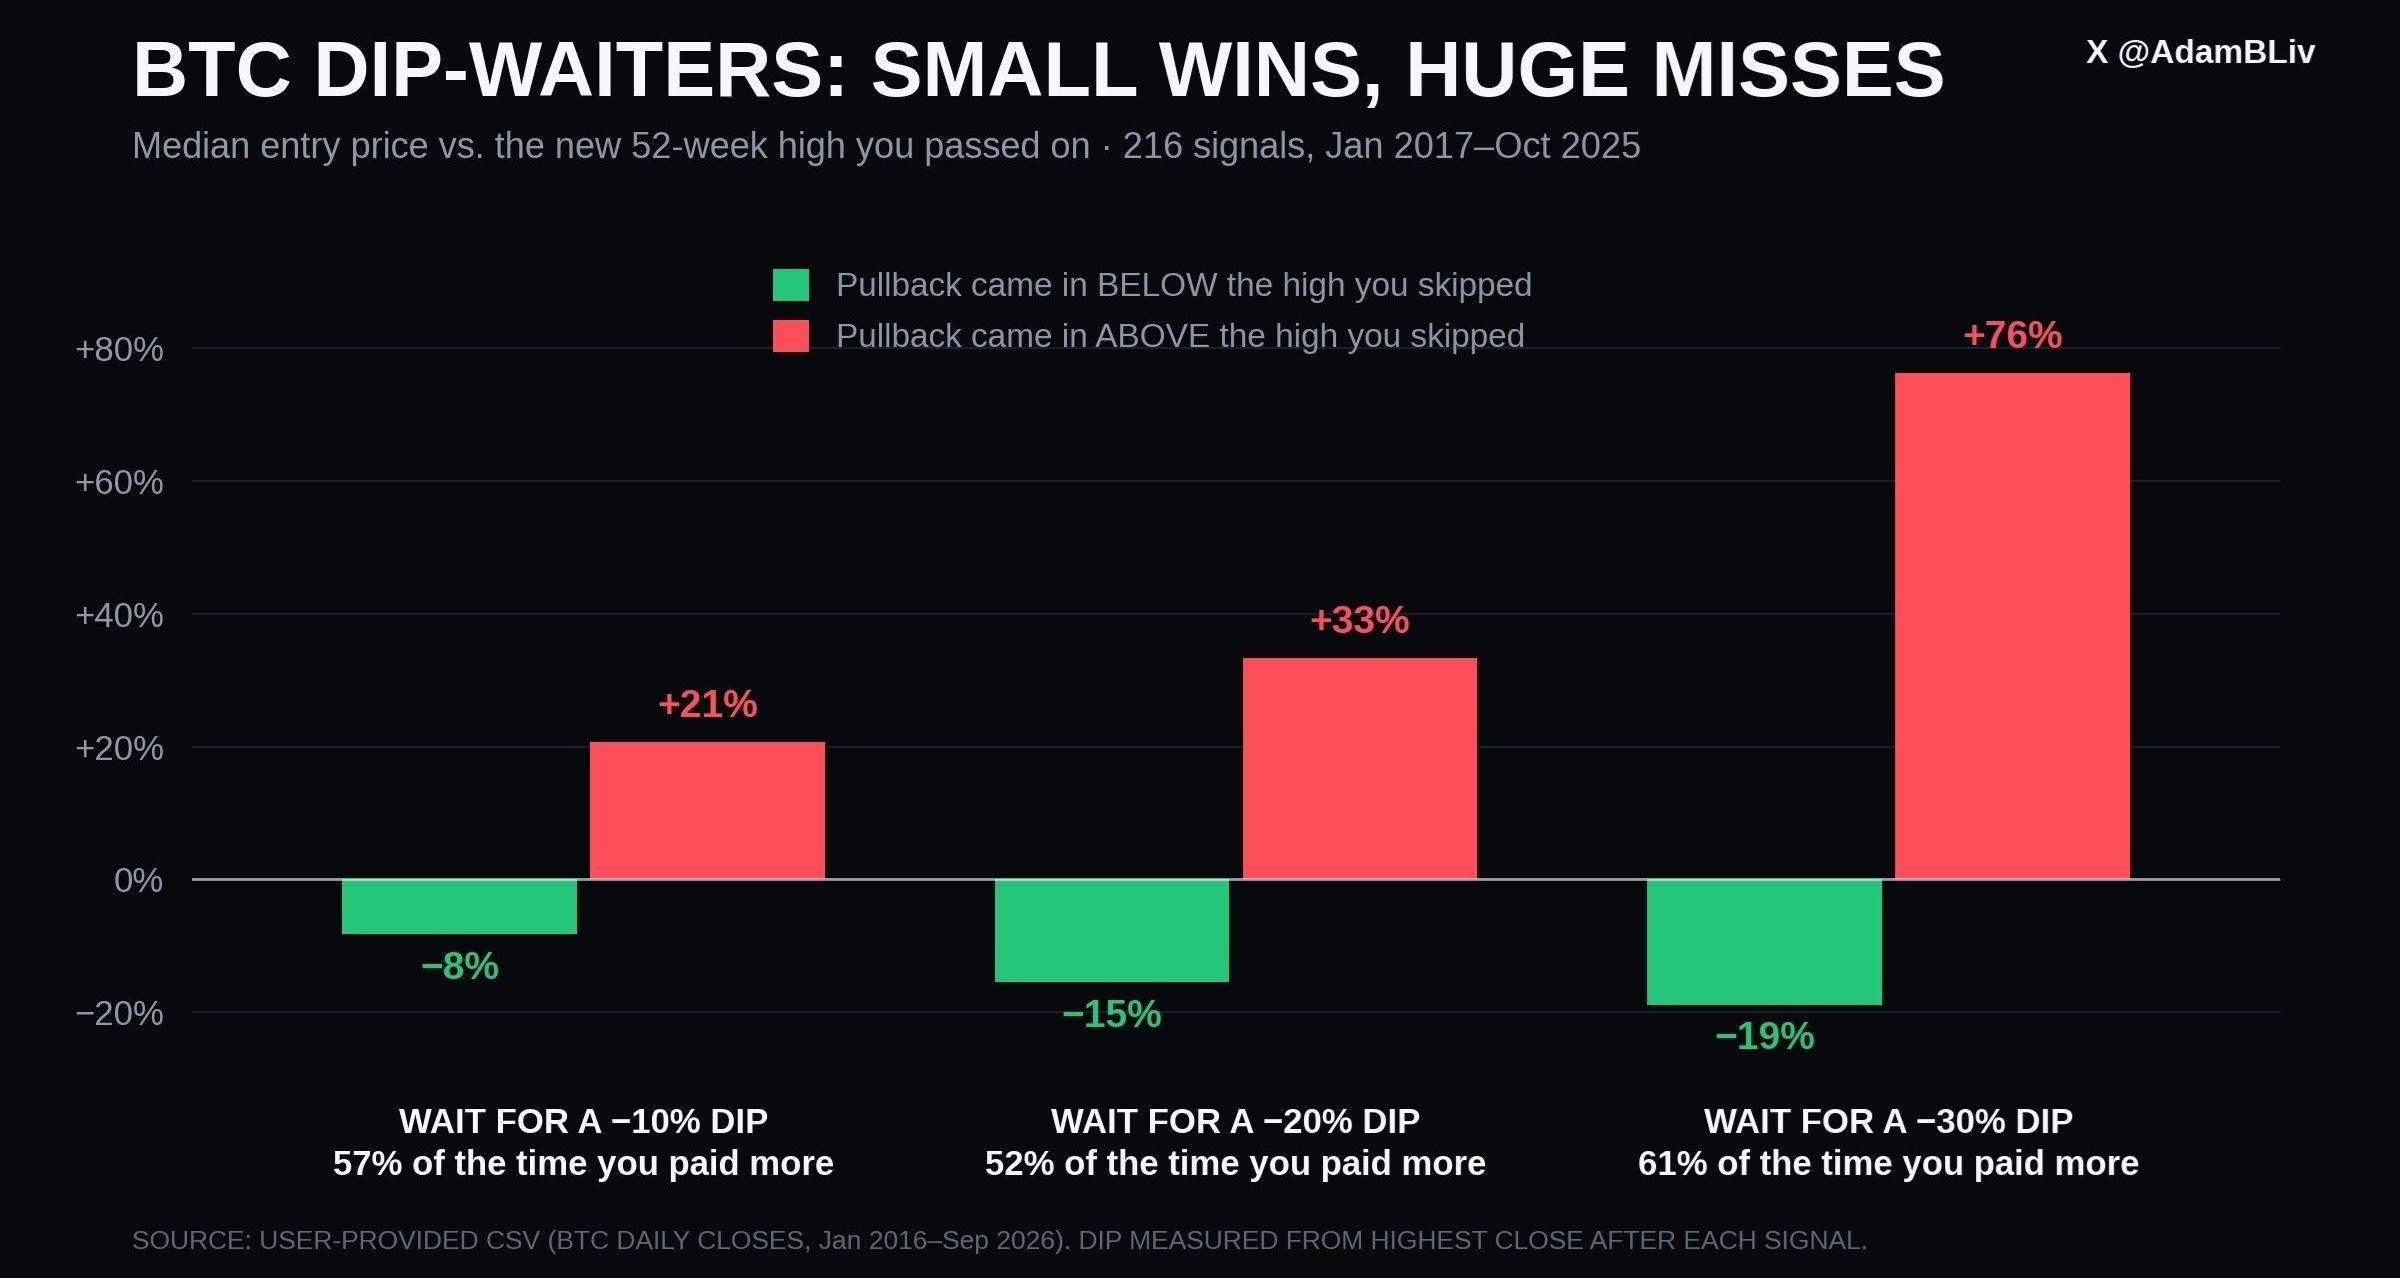
A similar pattern appears with smaller drawdowns as well, though the waiting time is shorter. A 10% drop occurs after a median of 14 days, but the modeled entry price is still higher than the missed price in 57% of cases. A 20% drop takes a median of 44 days and results in a higher entry price in 52% of cases. Blackrock notes that Bitcoin’s strong growth phases are often accompanied by significant volatility.
A chart distinguishes cases where waiting paid off from cases that did not. For the 30% rule, the median entry price was 19% lower than the initial high when this strategy achieved a lower price. When the strategy produced a higher price, the median entry point was 76% higher than that high. These differing outcomes reflect Bitcoin’s price volatility, as well as the speed and magnitude of price changes. These figures describe outcomes in Livingston’s historical test, not the gains or losses from an investor’s actual trades.
Ad
His calculation is based on daily closing prices and a specific rule for measuring the decline relative to the next high. Closing price can also vary depending on the data source and the time of day. For example, CF Benchmarks compute a daily reference price for bitcoin based on transactions across multiple exchanges at the time the market closes in New York. Livingston’s 216 signals may include near-term highs from the same upswing, so these percentages should not be interpreted as 216 independent market cycles.
2025’s Peak Level for Bitcoin Shows Both Sides of Trading
Waiting sometimes delivers a significantly lower entry price. Bitcoin hit a record above $126,000 in October 2025 before entering a prolonged downturn. This reversal illustrates the risk buyers face when they buy near the peak instead of waiting for a deeper correction.
By June 30, Bitcoin had fallen below $58,000, to less than half of its October peak. An investor waiting from that peak might have found a lower price. The result fits Livingston’s finding: his percentages compare each entry point for the final order with its original peak, based on a filtered set of signals.
On September 26, bitcoin was still about 33% below the October rebound record, even after recovering from the June low. That morning, it was traded near $84,162 after pulling back from the September peak of about $87,374. From the June low of roughly $57,735, bitcoin had recovered about 46% by September 26.