Update Trading Plan $BTC And $ETH Daily 28/9/2026:
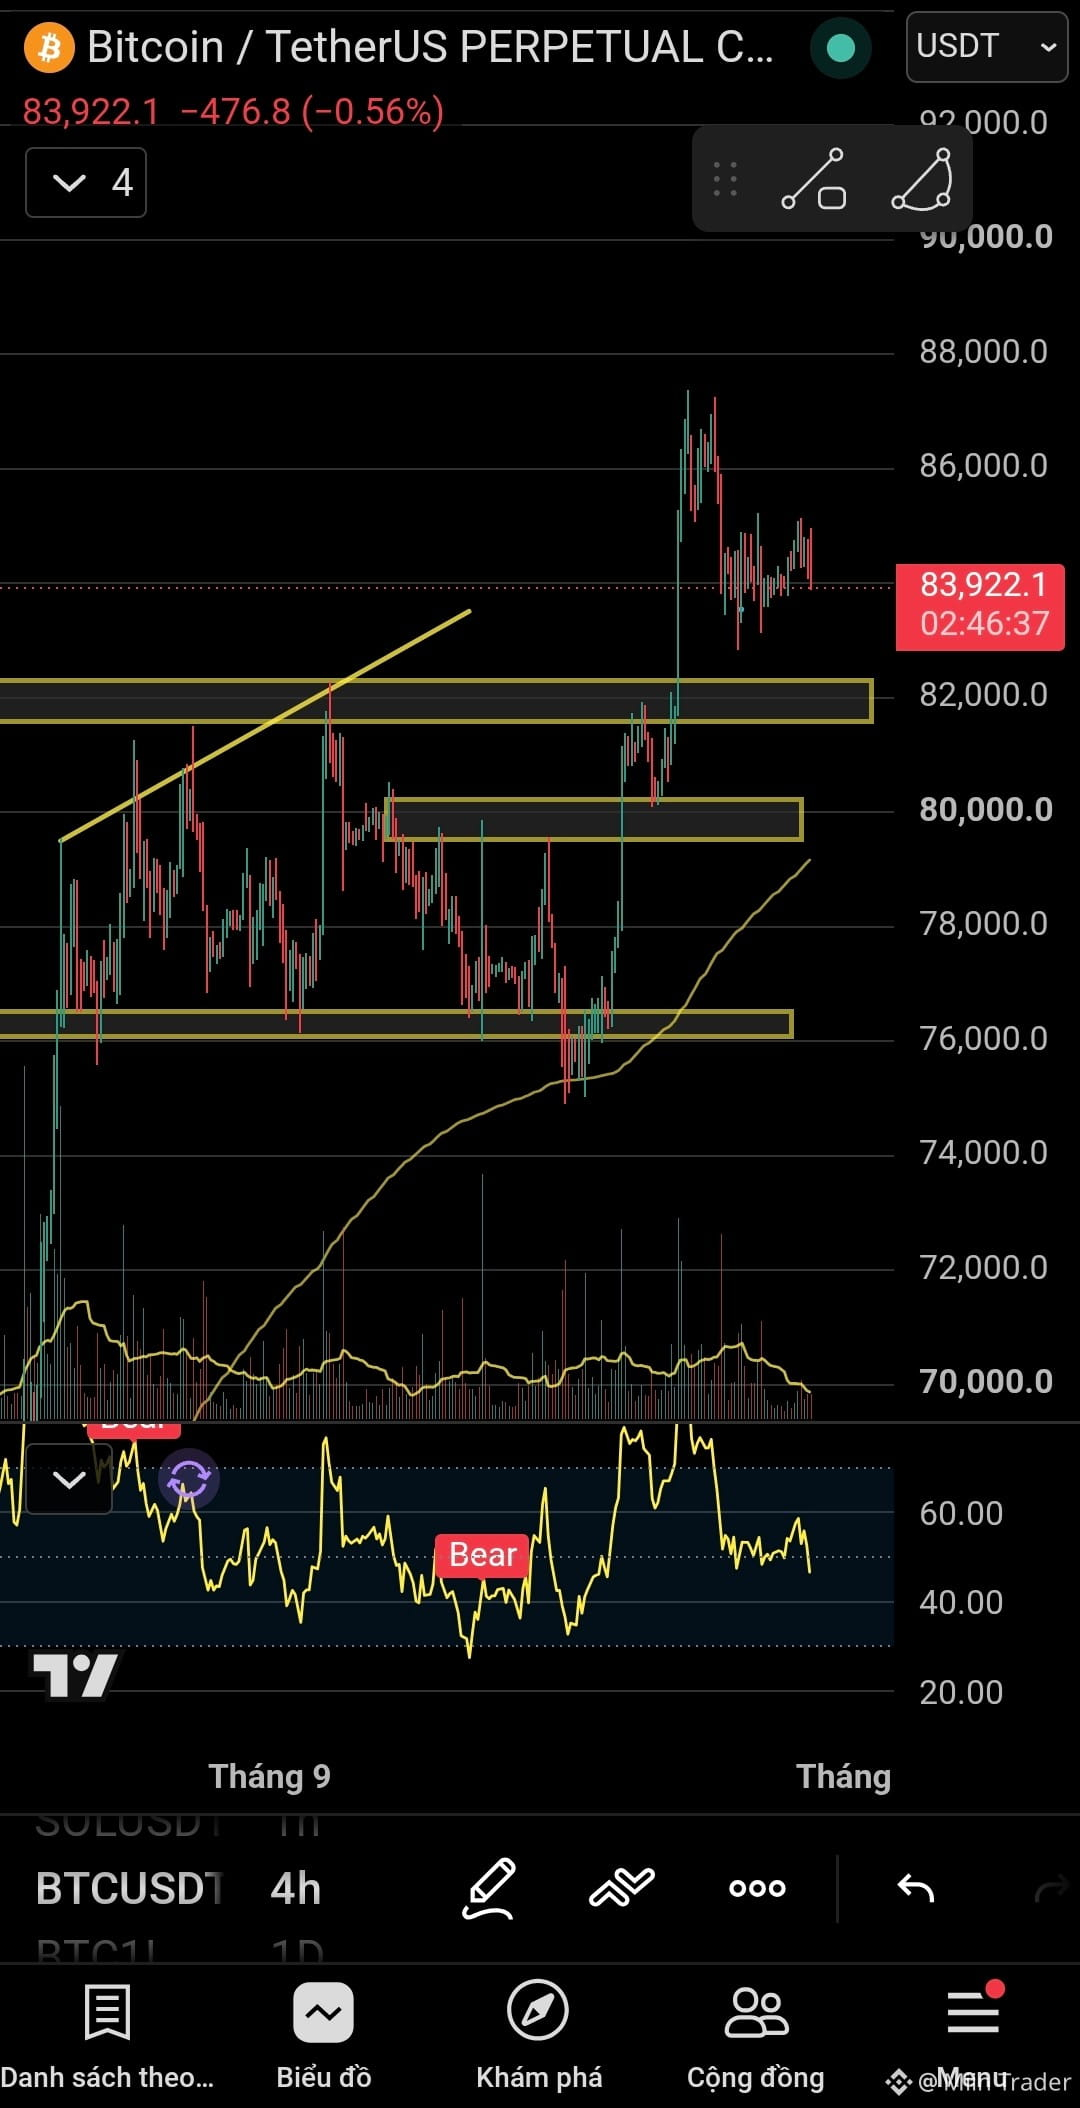
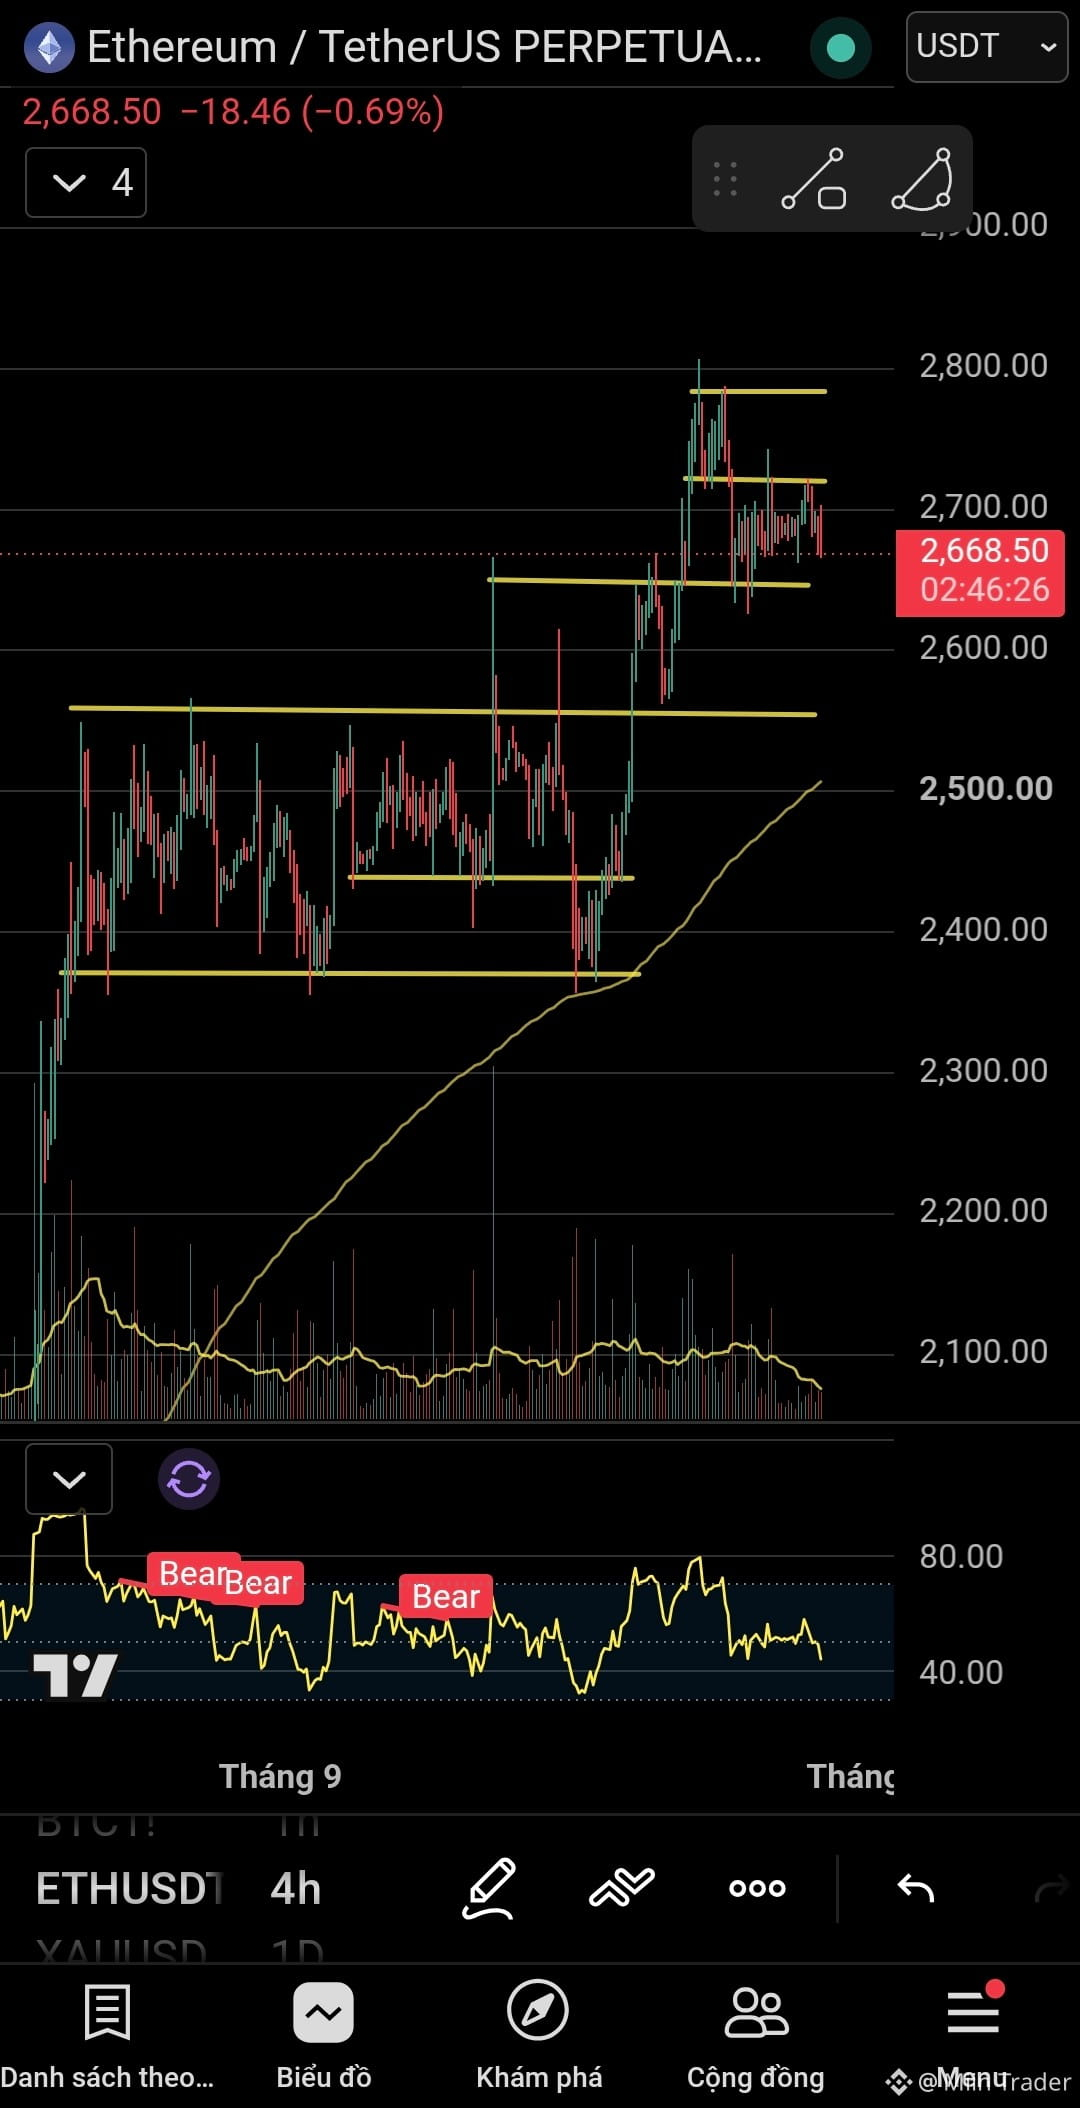
- On the H4 chart, BTC and ETH are forming a short-term bearish structure with red hammer candles signaling a reversal
- The Day candle closed a cluster of long lower-wick candles consecutively over the last 3 days
- The Supertrend indicator on the H1 timeframe is turning red, indicating short-term downside
- The nearest support zone for BTC is $82,000 and for ETH is $2,600
- The selling volume has started to participate strongly and the RSI indicator on the H4 timeframe is moving down into the oversold zone
=> Trading strategy: Prioritize a Short position when price hits the resistance levels to take advantage of the upcoming bearish wave
Trade at #BTC and #ETH here:
- On the H4 chart, BTC and ETH are forming a short-term bearish structure with red hammer candles signaling a reversal
- The Day candle closed a cluster of long lower-wick candles consecutively over the last 3 days
- The Supertrend indicator on the H1 timeframe is turning red, indicating short-term downside
- The nearest support zone for BTC is $82,000 and for ETH is $2,600
- The selling volume has started to participate strongly and the RSI indicator on the H4 timeframe is moving down into the oversold zone
=> Trading strategy: Prioritize a Short position when price hits the resistance levels to take advantage of the upcoming bearish wave
Trade at #BTC and #ETH here: