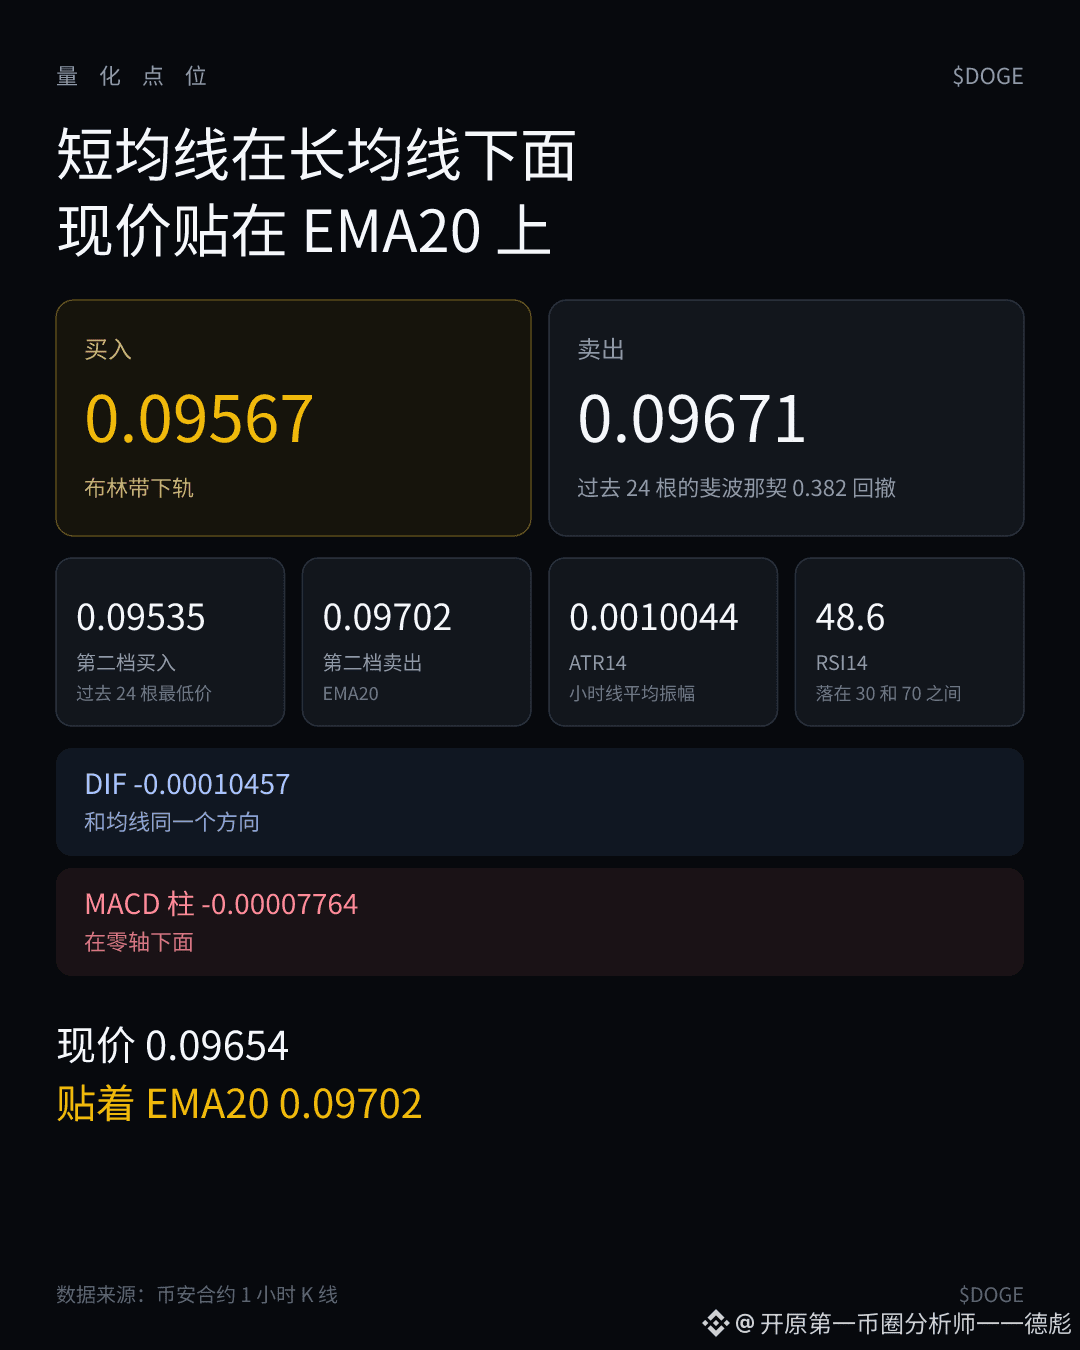
$DOGE current price 0.09654, bearish.
- Buy 0.09567
- Buy 0.09535
- Sell 0.09671
- Sell 0.09702
Moving averages. The short moving average is below the long moving average. The current price is sitting on the EMA20, only 0.48 ATR14 away.
The nearest buy is at the lower band of the Bollinger Bands, and the next buy level is the lowest price among the past 24 hourly candles.
The nearest sell is the 0.382 Fibonacci retracement of the past 24 hourly candles, and the farther sell is at the EMA20.
The long moving average, EMA60, is at 0.09708, still above the two sell levels.
Momentum. Same direction as the moving averages. The MACD DIF -0.00010457 is below the zero line. The histogram is -0.00007764, also below the zero line, and has not turned stronger yet. RSI14 is 48.6, between 30 and 70—not hot and not cold.
Volatility. The average candle range of these hourly candles is ATR14 0.0010044. Both the most recent buy and sell are still within this same range.
#DOGE
- Buy 0.09567
- Buy 0.09535
- Sell 0.09671
- Sell 0.09702
Moving averages. The short moving average is below the long moving average. The current price is sitting on the EMA20, only 0.48 ATR14 away.
The nearest buy is at the lower band of the Bollinger Bands, and the next buy level is the lowest price among the past 24 hourly candles.
The nearest sell is the 0.382 Fibonacci retracement of the past 24 hourly candles, and the farther sell is at the EMA20.
The long moving average, EMA60, is at 0.09708, still above the two sell levels.
Momentum. Same direction as the moving averages. The MACD DIF -0.00010457 is below the zero line. The histogram is -0.00007764, also below the zero line, and has not turned stronger yet. RSI14 is 48.6, between 30 and 70—not hot and not cold.
Volatility. The average candle range of these hourly candles is ATR14 0.0010044. Both the most recent buy and sell are still within this same range.
#DOGE