$ICNT
🟣 ICNT/USDT — RECOVERY IN PROGRESS, BUT WATCH THE RESISTANCE! 📊
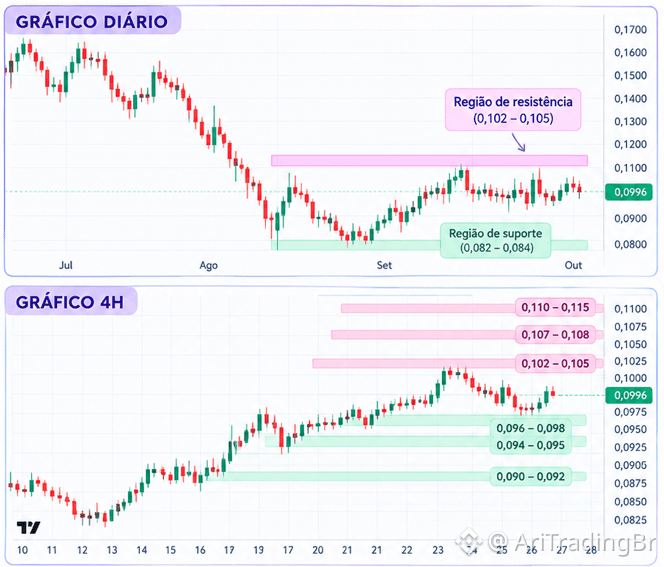
ICNT/USDT has been showing an interesting recovery after bottoming out in the 0.082–0.084 USDT area.
On the daily chart, however, the bigger structure is still a recovery after a strong drop. On the 4H chart, we can see a sequence of higher lows, indicating increasing buying strength in the short term.
The price tested the 0.104–0.105 USDT region, found sellers, and is now trading near 0.0996 USDT.
🔑 IMPORTANT LEVELS
🟢 Supports
• 0.096–0.098 → immediate support
• 0.094–0.095 → important support
• 0.090–0.092 → stronger support
🔴 Resistances
• 0.102–0.105 → main resistance
• 0.107–0.108 → next resistance
• 0.110–0.115 → upper resistance
📈 BULLISH SCENARIO
A 4H close above 0.105 could indicate continuation of the recovery.
In this scenario, the next attention areas would be:
0.105 → 0.108 → 0.110–0.115
An important point would be to watch for break + hold + retest, avoiding interpreting just an upper wick above resistance as confirmed breakout.
📉 CORRECTION SCENARIO
If the price loses 0.096–0.098, the short-term recovery may lose strength.
In that case, the market may return to test:
0.094–0.095 → 0.090–0.092
🧠 MY TAKE
ICNT is showing an interesting recovery on the 4H, but it is reaching a zone where sellers have already demonstrated presence.
That’s why 0.105 USDT is one of the most important levels to watch in the next candles.
👀 Now the question is: will ICNT manage to break this resistance and turn the recovery move into a new bullish leg?
Watching the close of the next candles may be more important than anticipating the move.
⚠️ Technical analysis based on the Daily and 4H charts provided. Not financial advice.
🟣 ICNT/USDT — RECOVERY IN PROGRESS, BUT WATCH THE RESISTANCE! 📊
ICNT/USDT has been showing an interesting recovery after bottoming out in the 0.082–0.084 USDT area.
On the daily chart, however, the bigger structure is still a recovery after a strong drop. On the 4H chart, we can see a sequence of higher lows, indicating increasing buying strength in the short term.
The price tested the 0.104–0.105 USDT region, found sellers, and is now trading near 0.0996 USDT.
🔑 IMPORTANT LEVELS
🟢 Supports
• 0.096–0.098 → immediate support
• 0.094–0.095 → important support
• 0.090–0.092 → stronger support
🔴 Resistances
• 0.102–0.105 → main resistance
• 0.107–0.108 → next resistance
• 0.110–0.115 → upper resistance
📈 BULLISH SCENARIO
A 4H close above 0.105 could indicate continuation of the recovery.
In this scenario, the next attention areas would be:
0.105 → 0.108 → 0.110–0.115
An important point would be to watch for break + hold + retest, avoiding interpreting just an upper wick above resistance as confirmed breakout.
📉 CORRECTION SCENARIO
If the price loses 0.096–0.098, the short-term recovery may lose strength.
In that case, the market may return to test:
0.094–0.095 → 0.090–0.092
🧠 MY TAKE
ICNT is showing an interesting recovery on the 4H, but it is reaching a zone where sellers have already demonstrated presence.
That’s why 0.105 USDT is one of the most important levels to watch in the next candles.
👀 Now the question is: will ICNT manage to break this resistance and turn the recovery move into a new bullish leg?
Watching the close of the next candles may be more important than anticipating the move.
⚠️ Technical analysis based on the Daily and 4H charts provided. Not financial advice.