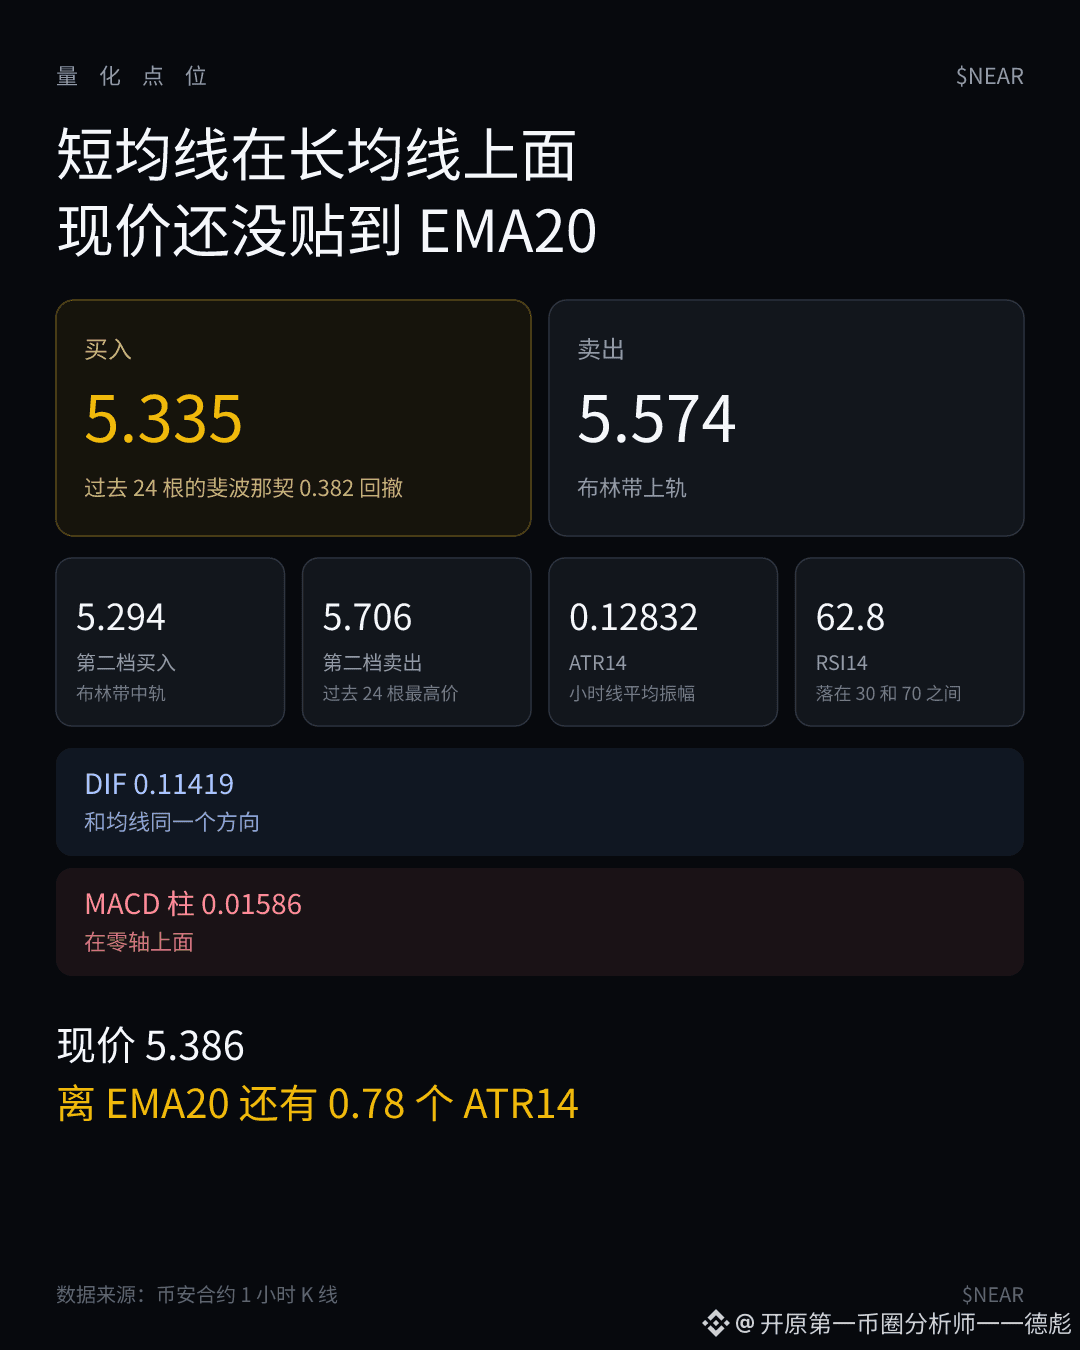
$NEAR Current price 5.386, bullish。
- Buy 5.335
- Buy 5.294
- Sell 5.574
- Sell 5.706
Moving averages. The short-term moving average is above the long-term one. The current price is still 0.78 ATR14 away from the EMA20 and hasn’t touched it yet.
The nearest buy is the 0.382 Fibonacci retracement of the past 24 hourly candles; the next buy is the Bollinger Band midline.
The nearest sell is the Bollinger Band upper band; the far sell is the highest price of the past 24 hourly candles.
The long-term moving average EMA60 is 5.068, still below two buy levels.
Momentum. Same direction as the moving averages. MACD DIF 0.11419 is above the zero line. The histogram is 0.01586, also above the zero line, and hasn’t weakened yet. RSI14 is 62.8, between 30 and 70—neither hot nor cold.
Volatility. The average swing for this set of hourly candles is ATR14 0.12832。
#NEAR
- Buy 5.335
- Buy 5.294
- Sell 5.574
- Sell 5.706
Moving averages. The short-term moving average is above the long-term one. The current price is still 0.78 ATR14 away from the EMA20 and hasn’t touched it yet.
The nearest buy is the 0.382 Fibonacci retracement of the past 24 hourly candles; the next buy is the Bollinger Band midline.
The nearest sell is the Bollinger Band upper band; the far sell is the highest price of the past 24 hourly candles.
The long-term moving average EMA60 is 5.068, still below two buy levels.
Momentum. Same direction as the moving averages. MACD DIF 0.11419 is above the zero line. The histogram is 0.01586, also above the zero line, and hasn’t weakened yet. RSI14 is 62.8, between 30 and 70—neither hot nor cold.
Volatility. The average swing for this set of hourly candles is ATR14 0.12832。
#NEAR