$SAGA coin in the decision-cut zone: Will the current rebound succeed, or is there more downside? 📊🔥
After the sharp bearish wave that hit the $SAGA coin and caused it to drop by roughly 15.85%, many traders who got stuck at high buy levels (above 0.030) are now wondering what the next move will be. The intraday chart is now sending extremely important technical signals.
🔍 Price action breakdown from the current chart:
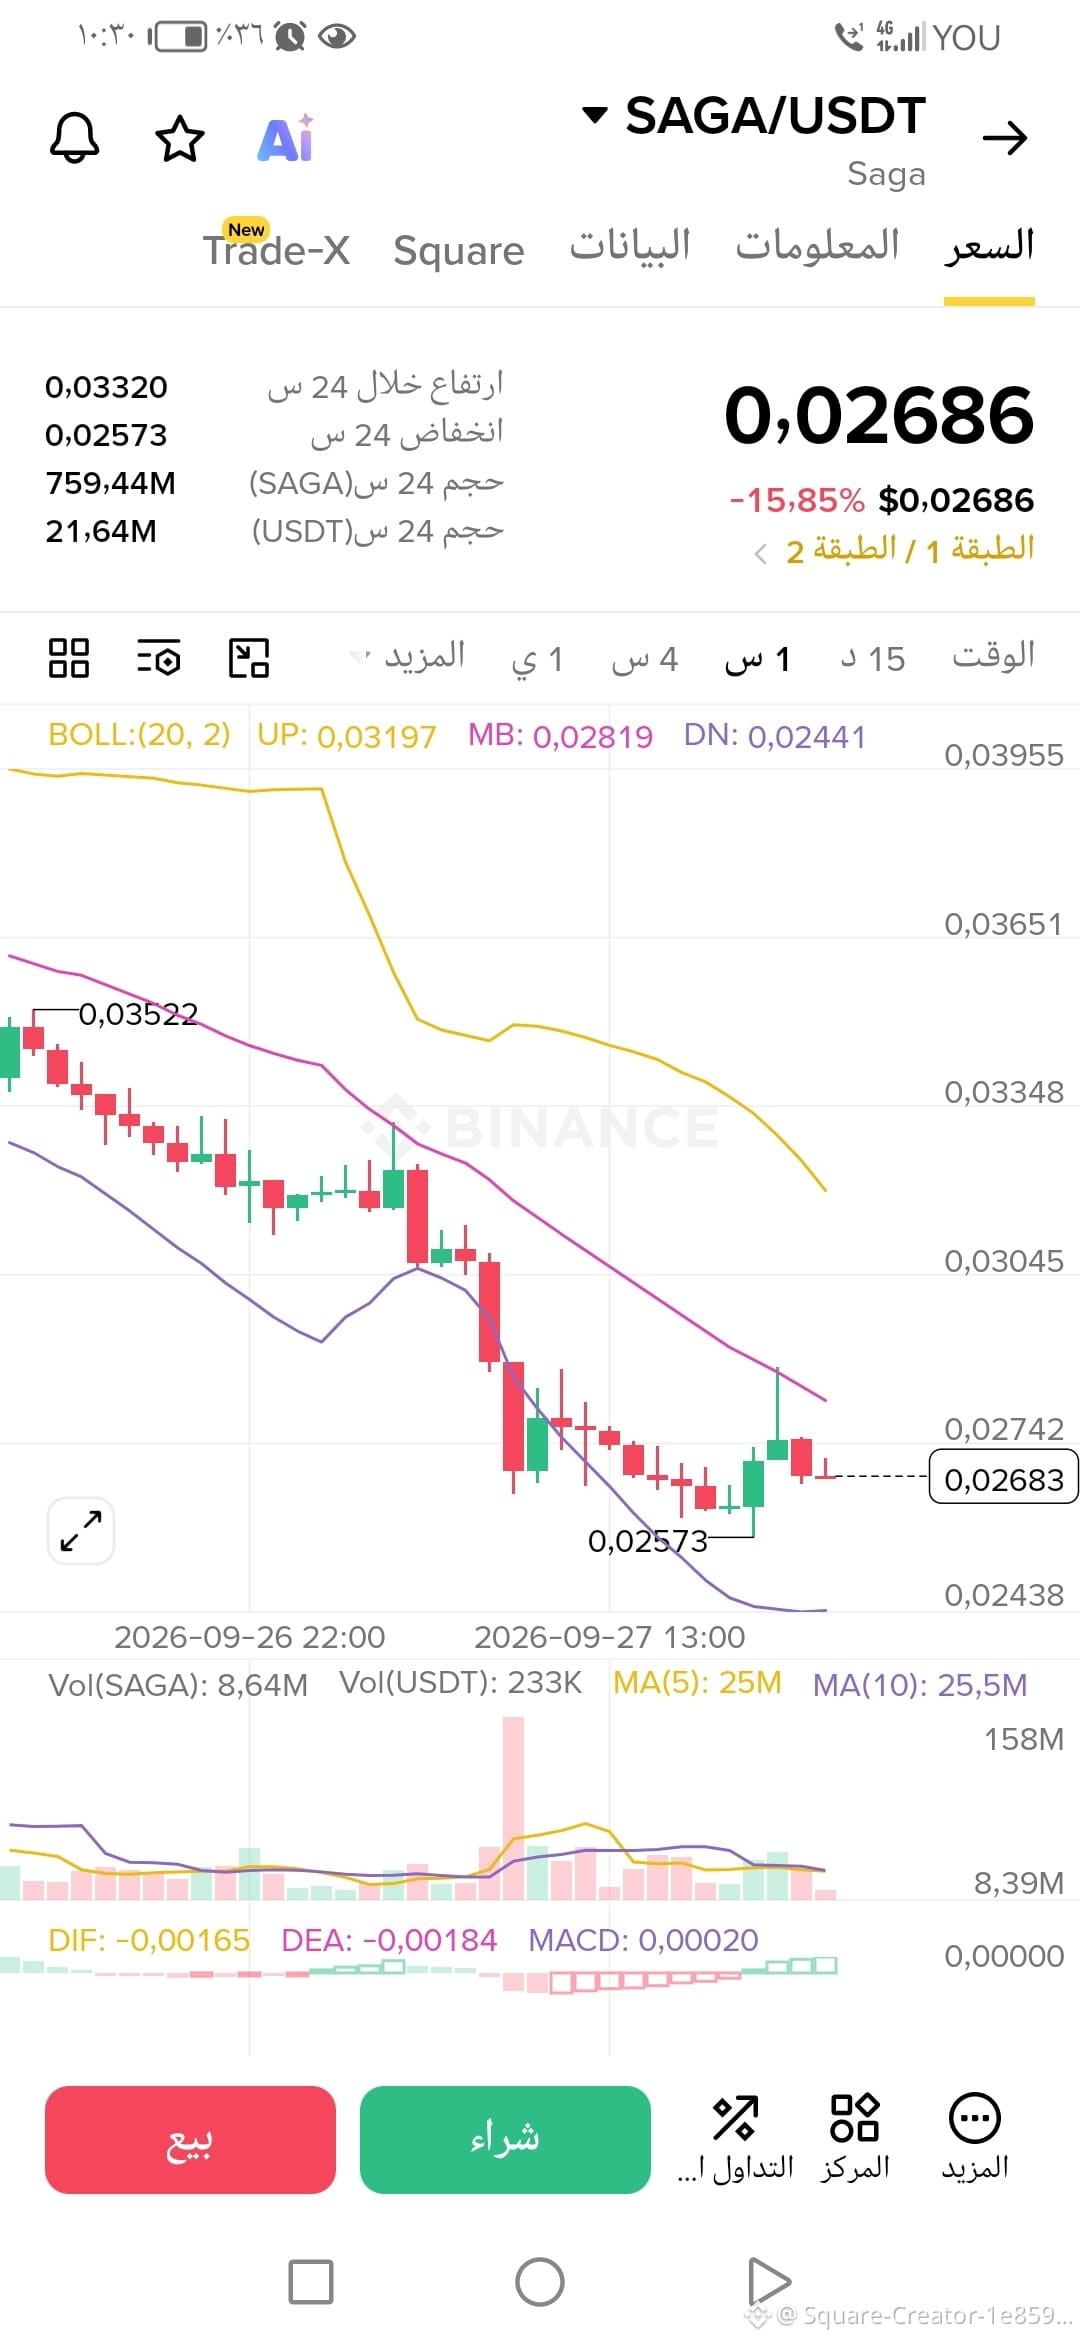
Forming the bottom: Price managed to find temporary support and rebound from 0.02573$, forming a green candle that reflects strong buying pressure aimed at preventing further bleeding toward the lower Bollinger Band line (DN: 0.02441).
Momentum signal (MACD): We notice a very important positive turning point below the chart. The MACD starts to form a bullish crossover (DIF: -0.00165 / DEA: -0.00184) and the histogram bars turn green, indicating weakening bearish control and the beginning of liquidity accumulation.
The next key: Price is currently trading at 0.02686$, and the most important near-term target is to break through and hold above the middle Bollinger Band line at 0.02819$, reopening the path toward the 0.03197$ area.
💡 Risk management advice:
Experiencing unrealized losses and testing your patience is an inseparable part of financial markets. Emotional selling out of fear at the lows is often followed by regret. Monitor current closes carefully, and make capital management your top priority at all times.
#SAGA #CryptoAnalysis #BinanceSquare #TradingTips
After the sharp bearish wave that hit the $SAGA coin and caused it to drop by roughly 15.85%, many traders who got stuck at high buy levels (above 0.030) are now wondering what the next move will be. The intraday chart is now sending extremely important technical signals.
🔍 Price action breakdown from the current chart:
Forming the bottom: Price managed to find temporary support and rebound from 0.02573$, forming a green candle that reflects strong buying pressure aimed at preventing further bleeding toward the lower Bollinger Band line (DN: 0.02441).
Momentum signal (MACD): We notice a very important positive turning point below the chart. The MACD starts to form a bullish crossover (DIF: -0.00165 / DEA: -0.00184) and the histogram bars turn green, indicating weakening bearish control and the beginning of liquidity accumulation.
The next key: Price is currently trading at 0.02686$, and the most important near-term target is to break through and hold above the middle Bollinger Band line at 0.02819$, reopening the path toward the 0.03197$ area.
💡 Risk management advice:
Experiencing unrealized losses and testing your patience is an inseparable part of financial markets. Emotional selling out of fear at the lows is often followed by regret. Monitor current closes carefully, and make capital management your top priority at all times.
#SAGA #CryptoAnalysis #BinanceSquare #TradingTips