$BTC Crypto Circle Academician: 9/28 Bitcoin (BTC) Bull Market Consolidation — Hidden Dangers in the Mid-Cycle Pause. Dig for Turnaround Signals from a Cycle Perspective? Latest Market Analysis and Trading Suggestions
At the current price of 84,400, Bitcoin is range-bound at the highs—this is when delusions are easiest to breed. Bulls always feel a new high is about to come, while bears believe a drop could happen at any moment. The chart won’t move based on anyone’s wishes; everything depends on K-line signals. Also, with fellow coin friends heading north from a low position, don’t rush to jump ship—especially those who entered from 65,000 and 75,500; you can reduce holdings, but don’t empty your shopping cart.
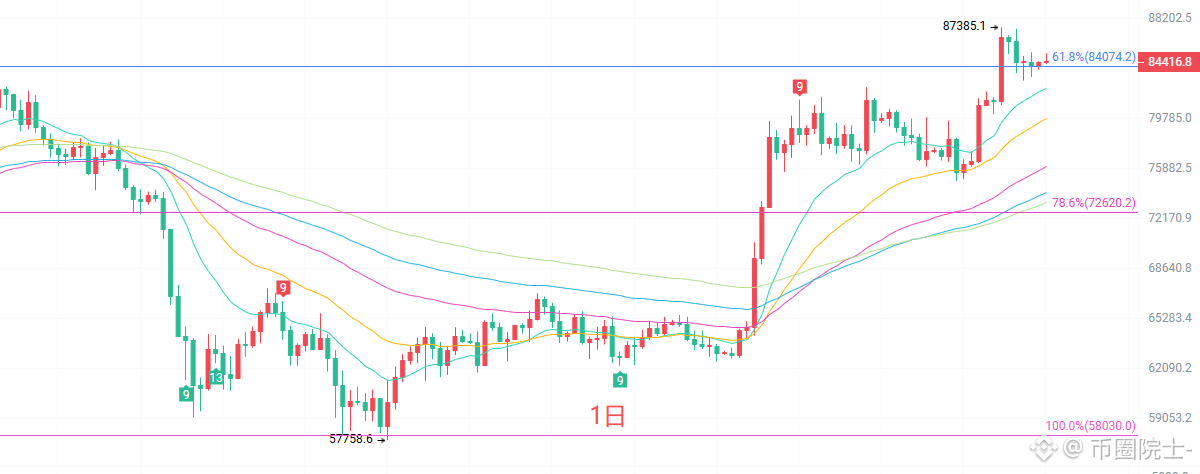
On the daily K-line, price is in the upper-middle band of the Bollinger Bands. The upper band is 87,753 and the lower band is 73,087. The daily EMA15 is at 82,261. The short-term moving averages still maintain a bullish alignment. The medium-to-long-term moving averages provide support from below, and the large-cycle bullish structure has not been broken. MACD upward momentum is starting to wane; the upward push is slowing, but a dead-cross reversal signal has not formed. The prior high at 87,385 is a strong resistance on the daily chart. If price cannot stand above it with volume, it will likely continue high-level consolidation. Only if there is an effective breakdown below the EMA15 line will the short-term market turn into a pullback.
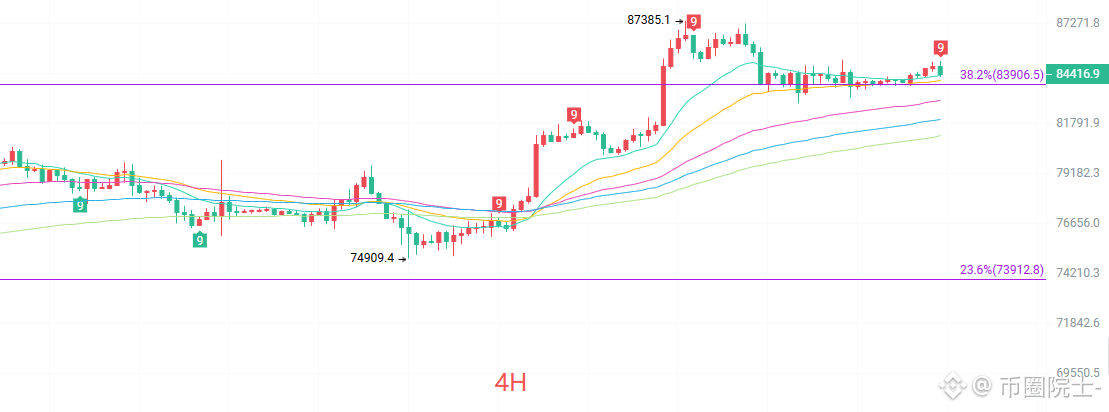
On the four-hour K-line, price is hugging the Bollinger middle band. The upper band is 84,857 and the lower band is 83,559. The Bollinger channel is narrowing, indicating that a trend change is about to occur in the near term. EMA15 is at 84,364. The short-term moving averages are sticking and intertwining, and bullish vs. bearish power is approaching balance. MACD bullish momentum has basically stalled—on the 4-hour view, after the high at 87,385, the price center of gravity has been drifting downward slowly. Each rebound’s height is gradually lower, forming a consolidation pattern after an advance. In the short term, there is a lack of sustained upside push; the oscillation range will keep constraining price movement.
Short-term reference
From 86,300 to 86,700 (move down/short): set stop-loss 500 points; target 85,500 to 84,500
From 83,500 to 83,000 (move up/long): set stop-loss 500 points; target 85,500 to 86,500
Specific execution should rely on real-time order book data. More information: you can check the author’s updates. Note that the article’s publication may be delayed; this is for reference only—risk is yours to bear.
#BTC走势分析 #BTC合约
At the current price of 84,400, Bitcoin is range-bound at the highs—this is when delusions are easiest to breed. Bulls always feel a new high is about to come, while bears believe a drop could happen at any moment. The chart won’t move based on anyone’s wishes; everything depends on K-line signals. Also, with fellow coin friends heading north from a low position, don’t rush to jump ship—especially those who entered from 65,000 and 75,500; you can reduce holdings, but don’t empty your shopping cart.
On the daily K-line, price is in the upper-middle band of the Bollinger Bands. The upper band is 87,753 and the lower band is 73,087. The daily EMA15 is at 82,261. The short-term moving averages still maintain a bullish alignment. The medium-to-long-term moving averages provide support from below, and the large-cycle bullish structure has not been broken. MACD upward momentum is starting to wane; the upward push is slowing, but a dead-cross reversal signal has not formed. The prior high at 87,385 is a strong resistance on the daily chart. If price cannot stand above it with volume, it will likely continue high-level consolidation. Only if there is an effective breakdown below the EMA15 line will the short-term market turn into a pullback.
On the four-hour K-line, price is hugging the Bollinger middle band. The upper band is 84,857 and the lower band is 83,559. The Bollinger channel is narrowing, indicating that a trend change is about to occur in the near term. EMA15 is at 84,364. The short-term moving averages are sticking and intertwining, and bullish vs. bearish power is approaching balance. MACD bullish momentum has basically stalled—on the 4-hour view, after the high at 87,385, the price center of gravity has been drifting downward slowly. Each rebound’s height is gradually lower, forming a consolidation pattern after an advance. In the short term, there is a lack of sustained upside push; the oscillation range will keep constraining price movement.
Short-term reference
From 86,300 to 86,700 (move down/short): set stop-loss 500 points; target 85,500 to 84,500
From 83,500 to 83,000 (move up/long): set stop-loss 500 points; target 85,500 to 86,500
Specific execution should rely on real-time order book data. More information: you can check the author’s updates. Note that the article’s publication may be delayed; this is for reference only—risk is yours to bear.
#BTC走势分析 #BTC合约