$ETH cryptocurrency circle academician: 9.28 Ethereum (ETH) daily bullish framework not broken—how to interpret short-term pullback signals? Latest market analysis reference
At the current price of 2690 for Ethereum, over the Mid-Autumn Festival these days the market has been slowly rising with only a very small range. Don’t let small day-to-day fluctuations make you change your plan temporarily—greed during consolidation easily causes you to give back all the profit you already have. Wait patiently for signals, hold your position, and opportunities are always there. With patience, you can even wait for a move to 1600 to the north, or even 4000 to the south—everything takes time to endure. What we need to do now is to calmly hold the northbound chips and exit in batches.
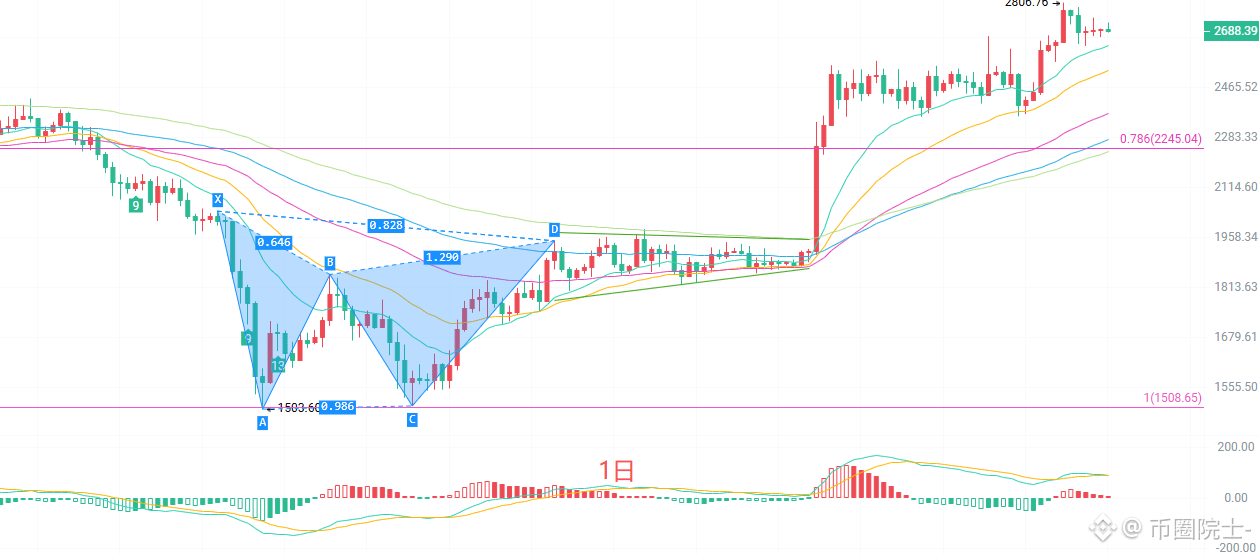
The daily K-line MA system remains in a bullish alignment, and the EMA medium-to-long-term bullish structure is intact. The Bollinger Bands are tightening; price is running near the upper band, meaning the upside space is temporarily compressed. The MACD red histogram continues to shrink; although DIF and DEA are still above the zero line, bullish momentum is gradually weakening—this looks like a sideways consolidation pattern at high levels. The previous high at 2806 is a strong resistance. The key support below lies around the EMA30 line. On the daily chart, no trend-reversal signal has appeared. At this stage, it is more like a consolidation (a continuation pause) after an upswing, and we should wait for a direction to be chosen.
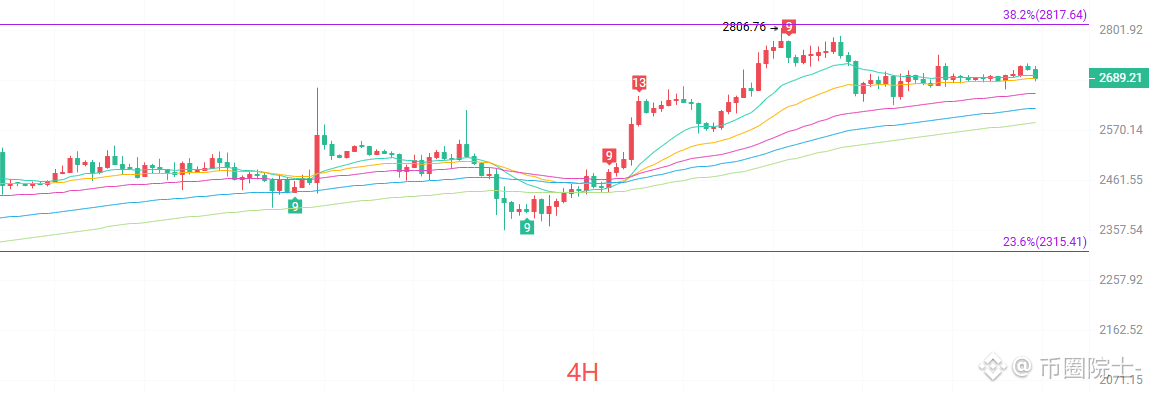
On the 4-hour chart, the EMA moving-average system is still bullish, but the short-term EMA 15 has flattened. Price repeatedly tests the moving-average support. The Bollinger Band channel is narrowing; the upper and lower band range is compressed, suggesting short-term volatility will gradually expand and a direction is likely to be chosen soon. The MACD indicator: DIF crosses below DEA to form a death cross, and short-term bearish force starts to release. The 4-hour timeframe is in a high-level pullback adjustment structure. Resistance is around 2717, and support is at 2659 near the Bollinger lower band. In the short term, it is biased toward relatively weak consolidation; if support holds, the market may rebound again to retest the highs. If support breaks, the room for the pullback will open up further.
Short-term references:
If the northbound support breaks down from 2650 to 2610, place a stop loss at 40 points; targets are 2720 to 2760.
If the southbound from 2750 to 2770 does not break through, place a stop loss at 40 points; targets are 2700 to 2660.
For specific execution, rely mainly on real-time order-book data. For more information, check what the author has published—there may be a delay in article release. This is for reference only; risk is your own.
#ETH走势分析 #ETH🔥🔥🔥🔥🔥🔥
At the current price of 2690 for Ethereum, over the Mid-Autumn Festival these days the market has been slowly rising with only a very small range. Don’t let small day-to-day fluctuations make you change your plan temporarily—greed during consolidation easily causes you to give back all the profit you already have. Wait patiently for signals, hold your position, and opportunities are always there. With patience, you can even wait for a move to 1600 to the north, or even 4000 to the south—everything takes time to endure. What we need to do now is to calmly hold the northbound chips and exit in batches.
The daily K-line MA system remains in a bullish alignment, and the EMA medium-to-long-term bullish structure is intact. The Bollinger Bands are tightening; price is running near the upper band, meaning the upside space is temporarily compressed. The MACD red histogram continues to shrink; although DIF and DEA are still above the zero line, bullish momentum is gradually weakening—this looks like a sideways consolidation pattern at high levels. The previous high at 2806 is a strong resistance. The key support below lies around the EMA30 line. On the daily chart, no trend-reversal signal has appeared. At this stage, it is more like a consolidation (a continuation pause) after an upswing, and we should wait for a direction to be chosen.
On the 4-hour chart, the EMA moving-average system is still bullish, but the short-term EMA 15 has flattened. Price repeatedly tests the moving-average support. The Bollinger Band channel is narrowing; the upper and lower band range is compressed, suggesting short-term volatility will gradually expand and a direction is likely to be chosen soon. The MACD indicator: DIF crosses below DEA to form a death cross, and short-term bearish force starts to release. The 4-hour timeframe is in a high-level pullback adjustment structure. Resistance is around 2717, and support is at 2659 near the Bollinger lower band. In the short term, it is biased toward relatively weak consolidation; if support holds, the market may rebound again to retest the highs. If support breaks, the room for the pullback will open up further.
Short-term references:
If the northbound support breaks down from 2650 to 2610, place a stop loss at 40 points; targets are 2720 to 2760.
If the southbound from 2750 to 2770 does not break through, place a stop loss at 40 points; targets are 2700 to 2660.
For specific execution, rely mainly on real-time order-book data. For more information, check what the author has published—there may be a delay in article release. This is for reference only; risk is your own.
#ETH走势分析 #ETH🔥🔥🔥🔥🔥🔥