Asset analysis of SOL/USDT (Solana)
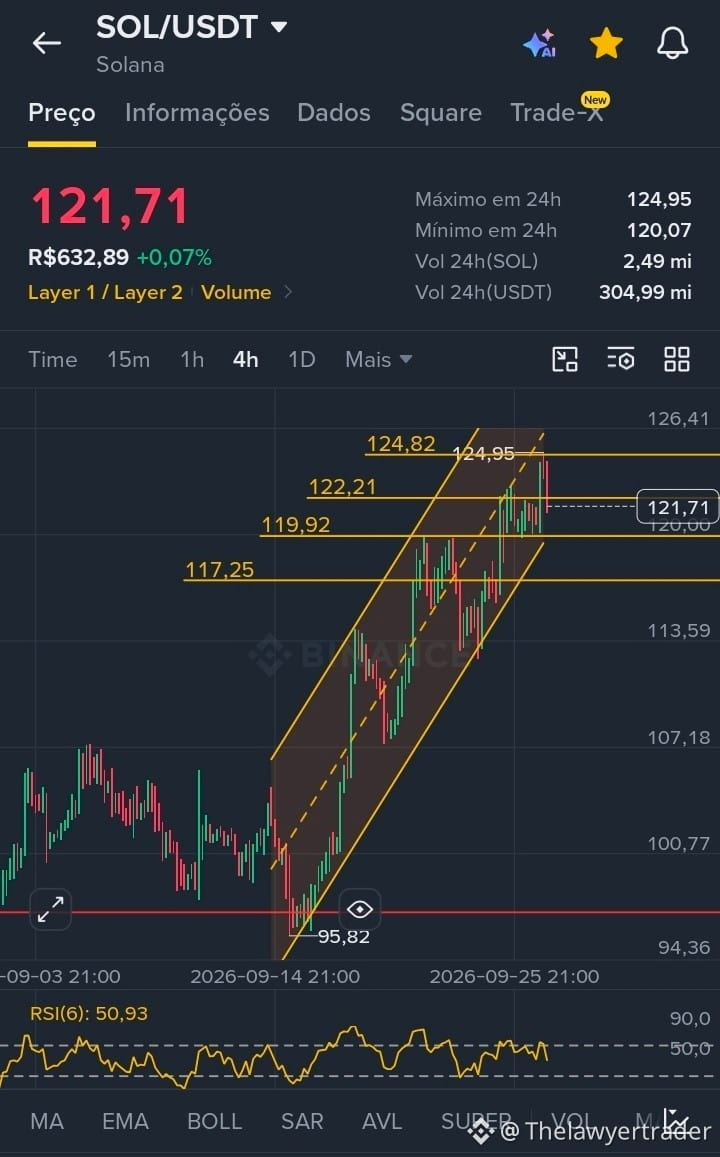
Solana shows a consolidated upward trend within a clearly defined ascending channel on the 4-hour chart, with the current price at 121.71 USDT, trading in the upper half of the channel.
Chart pattern and probability: the visible pattern is an upward channel, with a moderate probability of continuation as long as the price stays above the structure’s support. The asset pulled back slightly after touching the top resistance of the channel (124.95), and is now testing the middle/upper area. The continuation of the uptrend depends on maintaining the immediate support in the range of 119.92 to 117.25.
Reference levels:
Resistances: 122.21 and 124.82/124.95
Immediate support: 119.92 to 117.25
Momentum: RSI(6) at 50.93, neutral, with no clear overbought or oversold signals
Point of attention: neutral momentum suggests the price may either test the channel top again or retreat to the central support. The short-term outlook favors the uptrend only if the channel support is respected.
This content is for informational and educational purposes only. It does not constitute investment advice. The crypto market is highly risky, and every decision should consider your profile and objectives.
#sol #AnaliseTecnicaCripto $SOL
Solana shows a consolidated upward trend within a clearly defined ascending channel on the 4-hour chart, with the current price at 121.71 USDT, trading in the upper half of the channel.
Chart pattern and probability: the visible pattern is an upward channel, with a moderate probability of continuation as long as the price stays above the structure’s support. The asset pulled back slightly after touching the top resistance of the channel (124.95), and is now testing the middle/upper area. The continuation of the uptrend depends on maintaining the immediate support in the range of 119.92 to 117.25.
Reference levels:
Resistances: 122.21 and 124.82/124.95
Immediate support: 119.92 to 117.25
Momentum: RSI(6) at 50.93, neutral, with no clear overbought or oversold signals
Point of attention: neutral momentum suggests the price may either test the channel top again or retreat to the central support. The short-term outlook favors the uptrend only if the channel support is respected.
This content is for informational and educational purposes only. It does not constitute investment advice. The crypto market is highly risky, and every decision should consider your profile and objectives.
#sol #AnaliseTecnicaCripto $SOL