


Daily sharing
After the big pie pulled back around 82,874 on Thursday, it has basically stayed oscillating in the 83,000~85,000 range. The liquidity in the weekend market is relatively poor, so that can be understood. Personally, I think we should still wait and observe—next week it should still need to attempt another push upward, so that the 4-hour rebound structure is truly complete.
Overall, I believe the rebound at the daily timeframe level is in a state that is about to come to an end. So if we want to bet on a short-term rise, we need to make sure we have solid risk control in place. Next week, we should be able to wrap up the daily-timeframe rebound. Then in October, we’ll need to look for a daily-timeframe pullback; for the pullback, we should wait around 70,000. From November to the end of January, we’ll look for the third daily-timeframe rebound.
Medium- and short-term trend direction
4h cycle main direction: currently, it’s most likely the last 4h-level rebound within the daily-chart rebound, and it is already in the late stage.
1h cycle direction: for the short term, watch whether this 1h-level rebound can continue moving upward.
BTC short-term
Due to rapid changes in market conditions, this article can only make a projection of how the行情 will change at the moment of publication. Short-term traders, pay attention to the latest market changes—this is for reference only.
1H:
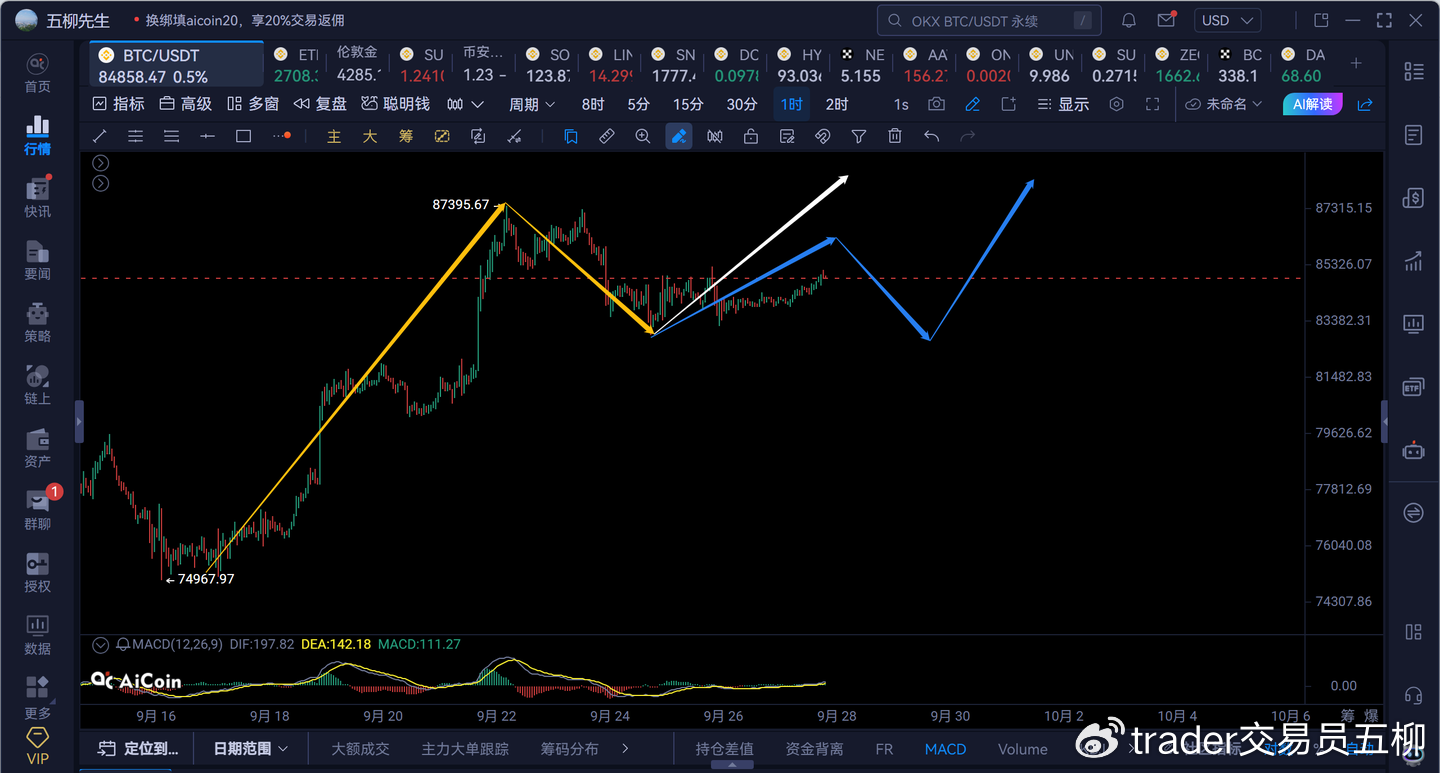
1)We are still within the scope of the third 1h-level rebound. Over the weekend the market tempo was too slow, so this 1h-level rebound should normally still have room to move upward.
2)First, see whether this 1h-level rebound can again surge above 87,000 to complete a 4h-level rebound.
3)If this 1h-level rebound cannot break above 86,000, then for now consider that price may consolidate in a 82,000~86,000 range on a 1h timeframe, and then move out of that range to go above 87,000, as shown in the blue arrow in the chart.
4)But pay attention in the short term: if there is another 1h pullback, it’s best not to fall below 81,500. If it breaks below, be cautious—this indicates a risk of a larger time-frame pullback. Although the final judgment is that the observation point for a daily-chart level pullback is 80,000—i.e., once it falls back below 80,000, the daily-chart rebound is likely over—if it breaks below 81,500, the probability of continuing to break below 80,000 keeps increasing.
5)If it gets another push higher, keep an eye on the 87,000~88,000 range. Normally, it should be about there. If it breaks above 88,600, then consider that short-term it may touch around 90,400.
15M:
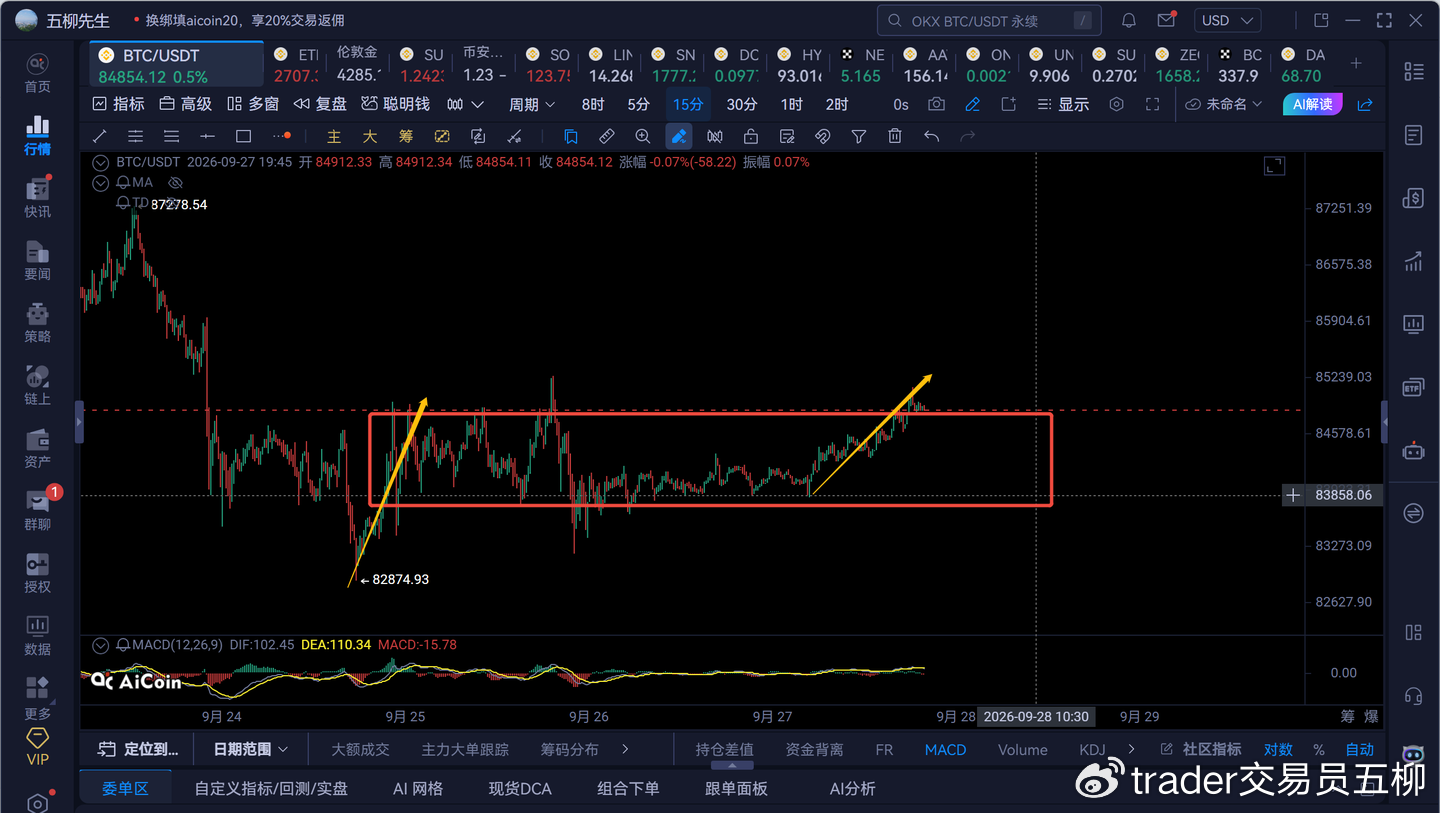
1)On the 15-minute timeframe: over the weekend, a 15-minute-level consolidation formed. Today it rebounded back above 85,000, but this 1h-level rebound should still have upside momentum.
2)If the short-term pullback does not break below 83,800, then you can continue to look for this 1h-level rebound to move upward again, and see whether it can reach above 87,000.
3)If the short-term pullback breaks below 83,800, then the short-term outlook is inclined to a 1h-level pullback. As long as the pullback stays above 81,500, there is still a chance to see another 1h-level rebound to the upside toward above 87,000.
ETH
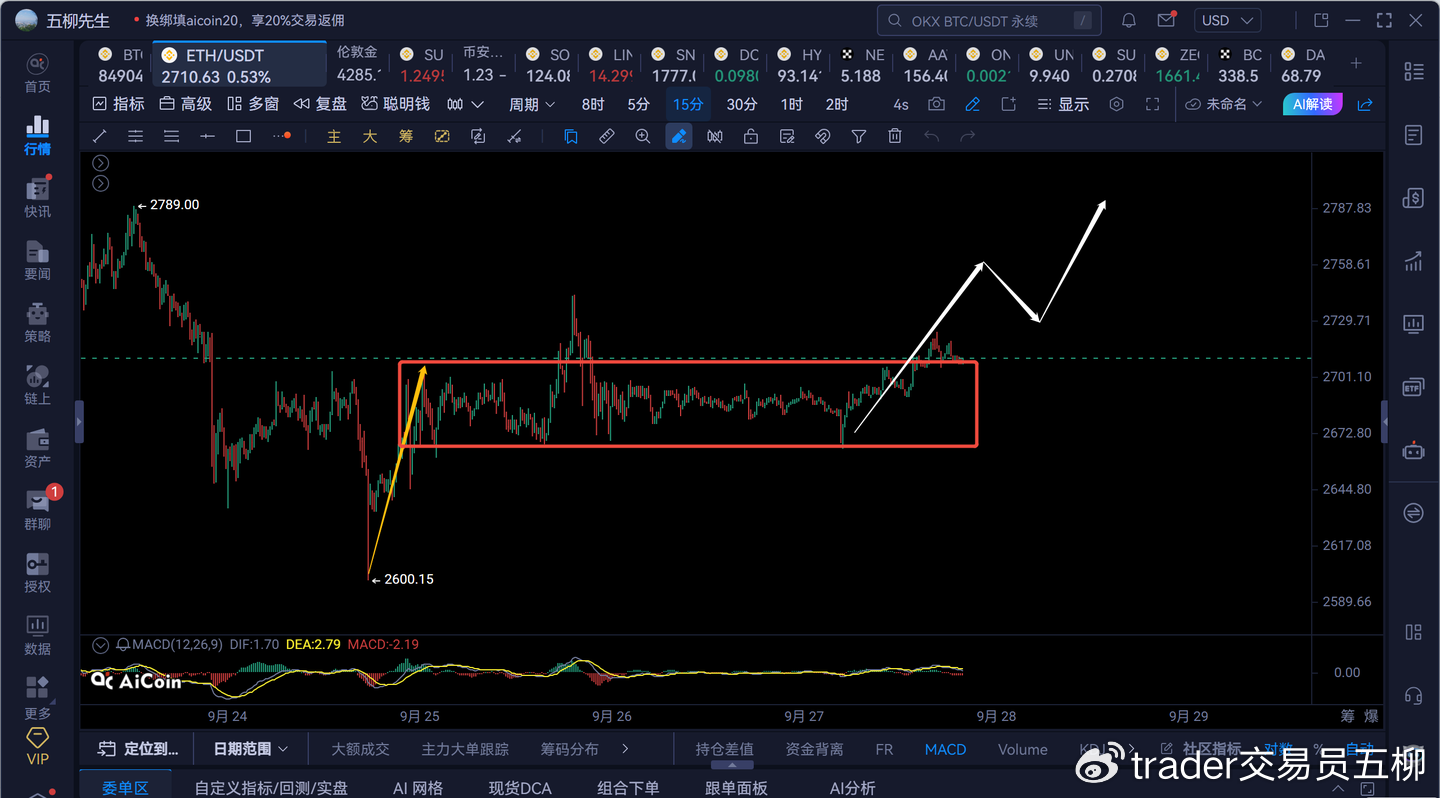
1)For ETH as well: the weekend also saw a 15-minute-level consolidation. Today it has rebounded somewhat. Here, watch whether the 1h-level rebound can continue moving upward—ideally it can try to break above 2,800 one more time.
2)As long as price stays above 2,664 in the short term, it should still be able to continue the 1h-level rebound. If it breaks below that level, then look for a 1h-level pullback to come down again and retest around 2,600.
3)Falling back below 2,570 indicates there is risk of a daily-chart level pullback. Falling below 2,540 confirms that the market is already in a daily-chart level pullback.
4)The inclination is that in October there will be a daily-chart level pullback. The target to watch is the 2,000~2,200 range.