$BTC Macro Cycle Loaded! Are you ready for the 1,000-day mega expansion? 🚀
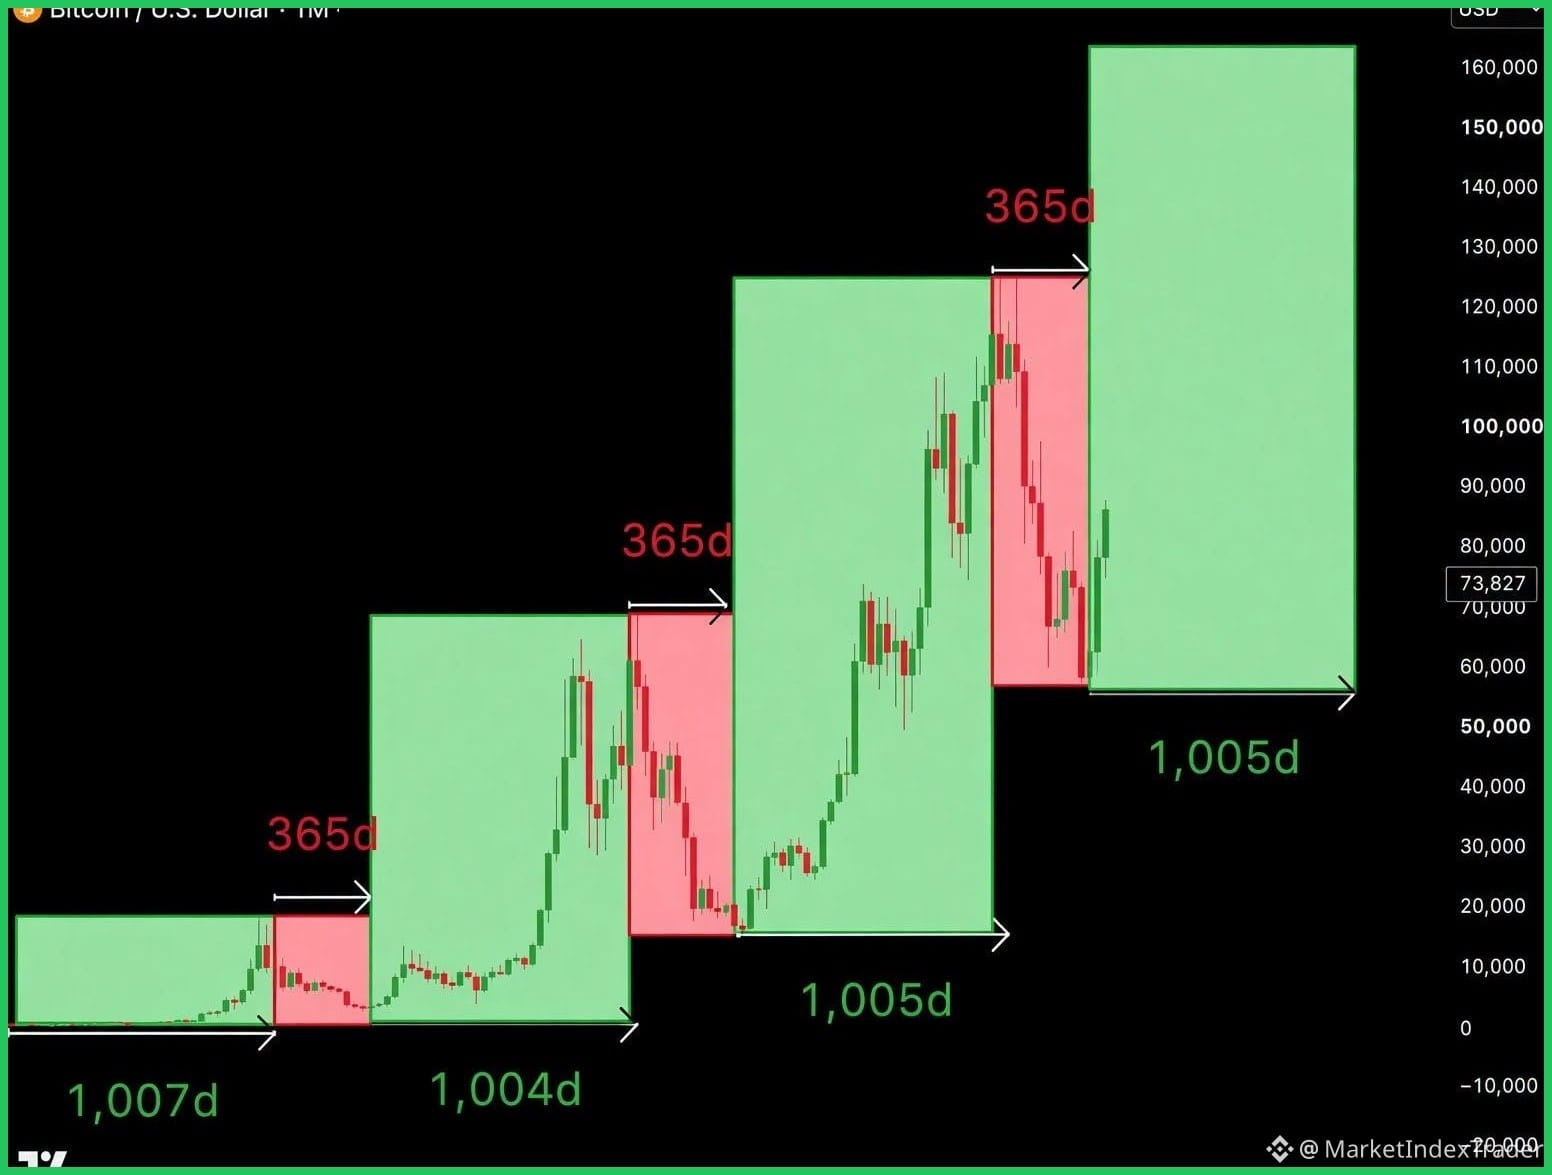
$BTC's macro chart reveals a repeating cycle of 365-day market resets followed by over 1,000 days of explosive parabolic growth.
Alright team, let's break down this legendary $BTC macro cycle chart and see what massive movement is brewing for Bitcoin!
Technical Analysis
Looking at historical cycle data, Bitcoin follows a remarkably consistent timeline. Each ~365-day correction phase (red blocks) gives way to an enormous ~1,000-day bullish expansion phase (green blocks). Having securely held macro support around the $55,000 - $60,000 zone, $BTC has officially entered its fresh 1,005-day expansion stage, projecting upside targets beyond $160,000.
Fundamental Analysis
Fundamentally, Bitcoin's foundation is stronger than ever. Continuous record inflows through spot BTC ETFs, coupled with the post-halving supply shock and expanding global liquidity, create the perfect macro storm for sustained upward momentum.
Action Plan
My strategy here is straightforward: ignore the short-term noise, accumulate on major dips, and let the multi-year cycle play out.
Highly recommend HOLD and Stacking $BTC at Binance
Feel free to comment the altcoin you are holding and we will check it for you!
BTC #TechnicalAnalysis #Crypto #BinanceSquare #Bitcoin
$BTC's macro chart reveals a repeating cycle of 365-day market resets followed by over 1,000 days of explosive parabolic growth.
Alright team, let's break down this legendary $BTC macro cycle chart and see what massive movement is brewing for Bitcoin!
Technical Analysis
Looking at historical cycle data, Bitcoin follows a remarkably consistent timeline. Each ~365-day correction phase (red blocks) gives way to an enormous ~1,000-day bullish expansion phase (green blocks). Having securely held macro support around the $55,000 - $60,000 zone, $BTC has officially entered its fresh 1,005-day expansion stage, projecting upside targets beyond $160,000.
Fundamental Analysis
Fundamentally, Bitcoin's foundation is stronger than ever. Continuous record inflows through spot BTC ETFs, coupled with the post-halving supply shock and expanding global liquidity, create the perfect macro storm for sustained upward momentum.
Action Plan
My strategy here is straightforward: ignore the short-term noise, accumulate on major dips, and let the multi-year cycle play out.
Highly recommend HOLD and Stacking $BTC at Binance
Feel free to comment the altcoin you are holding and we will check it for you!
BTC #TechnicalAnalysis #Crypto #BinanceSquare #Bitcoin