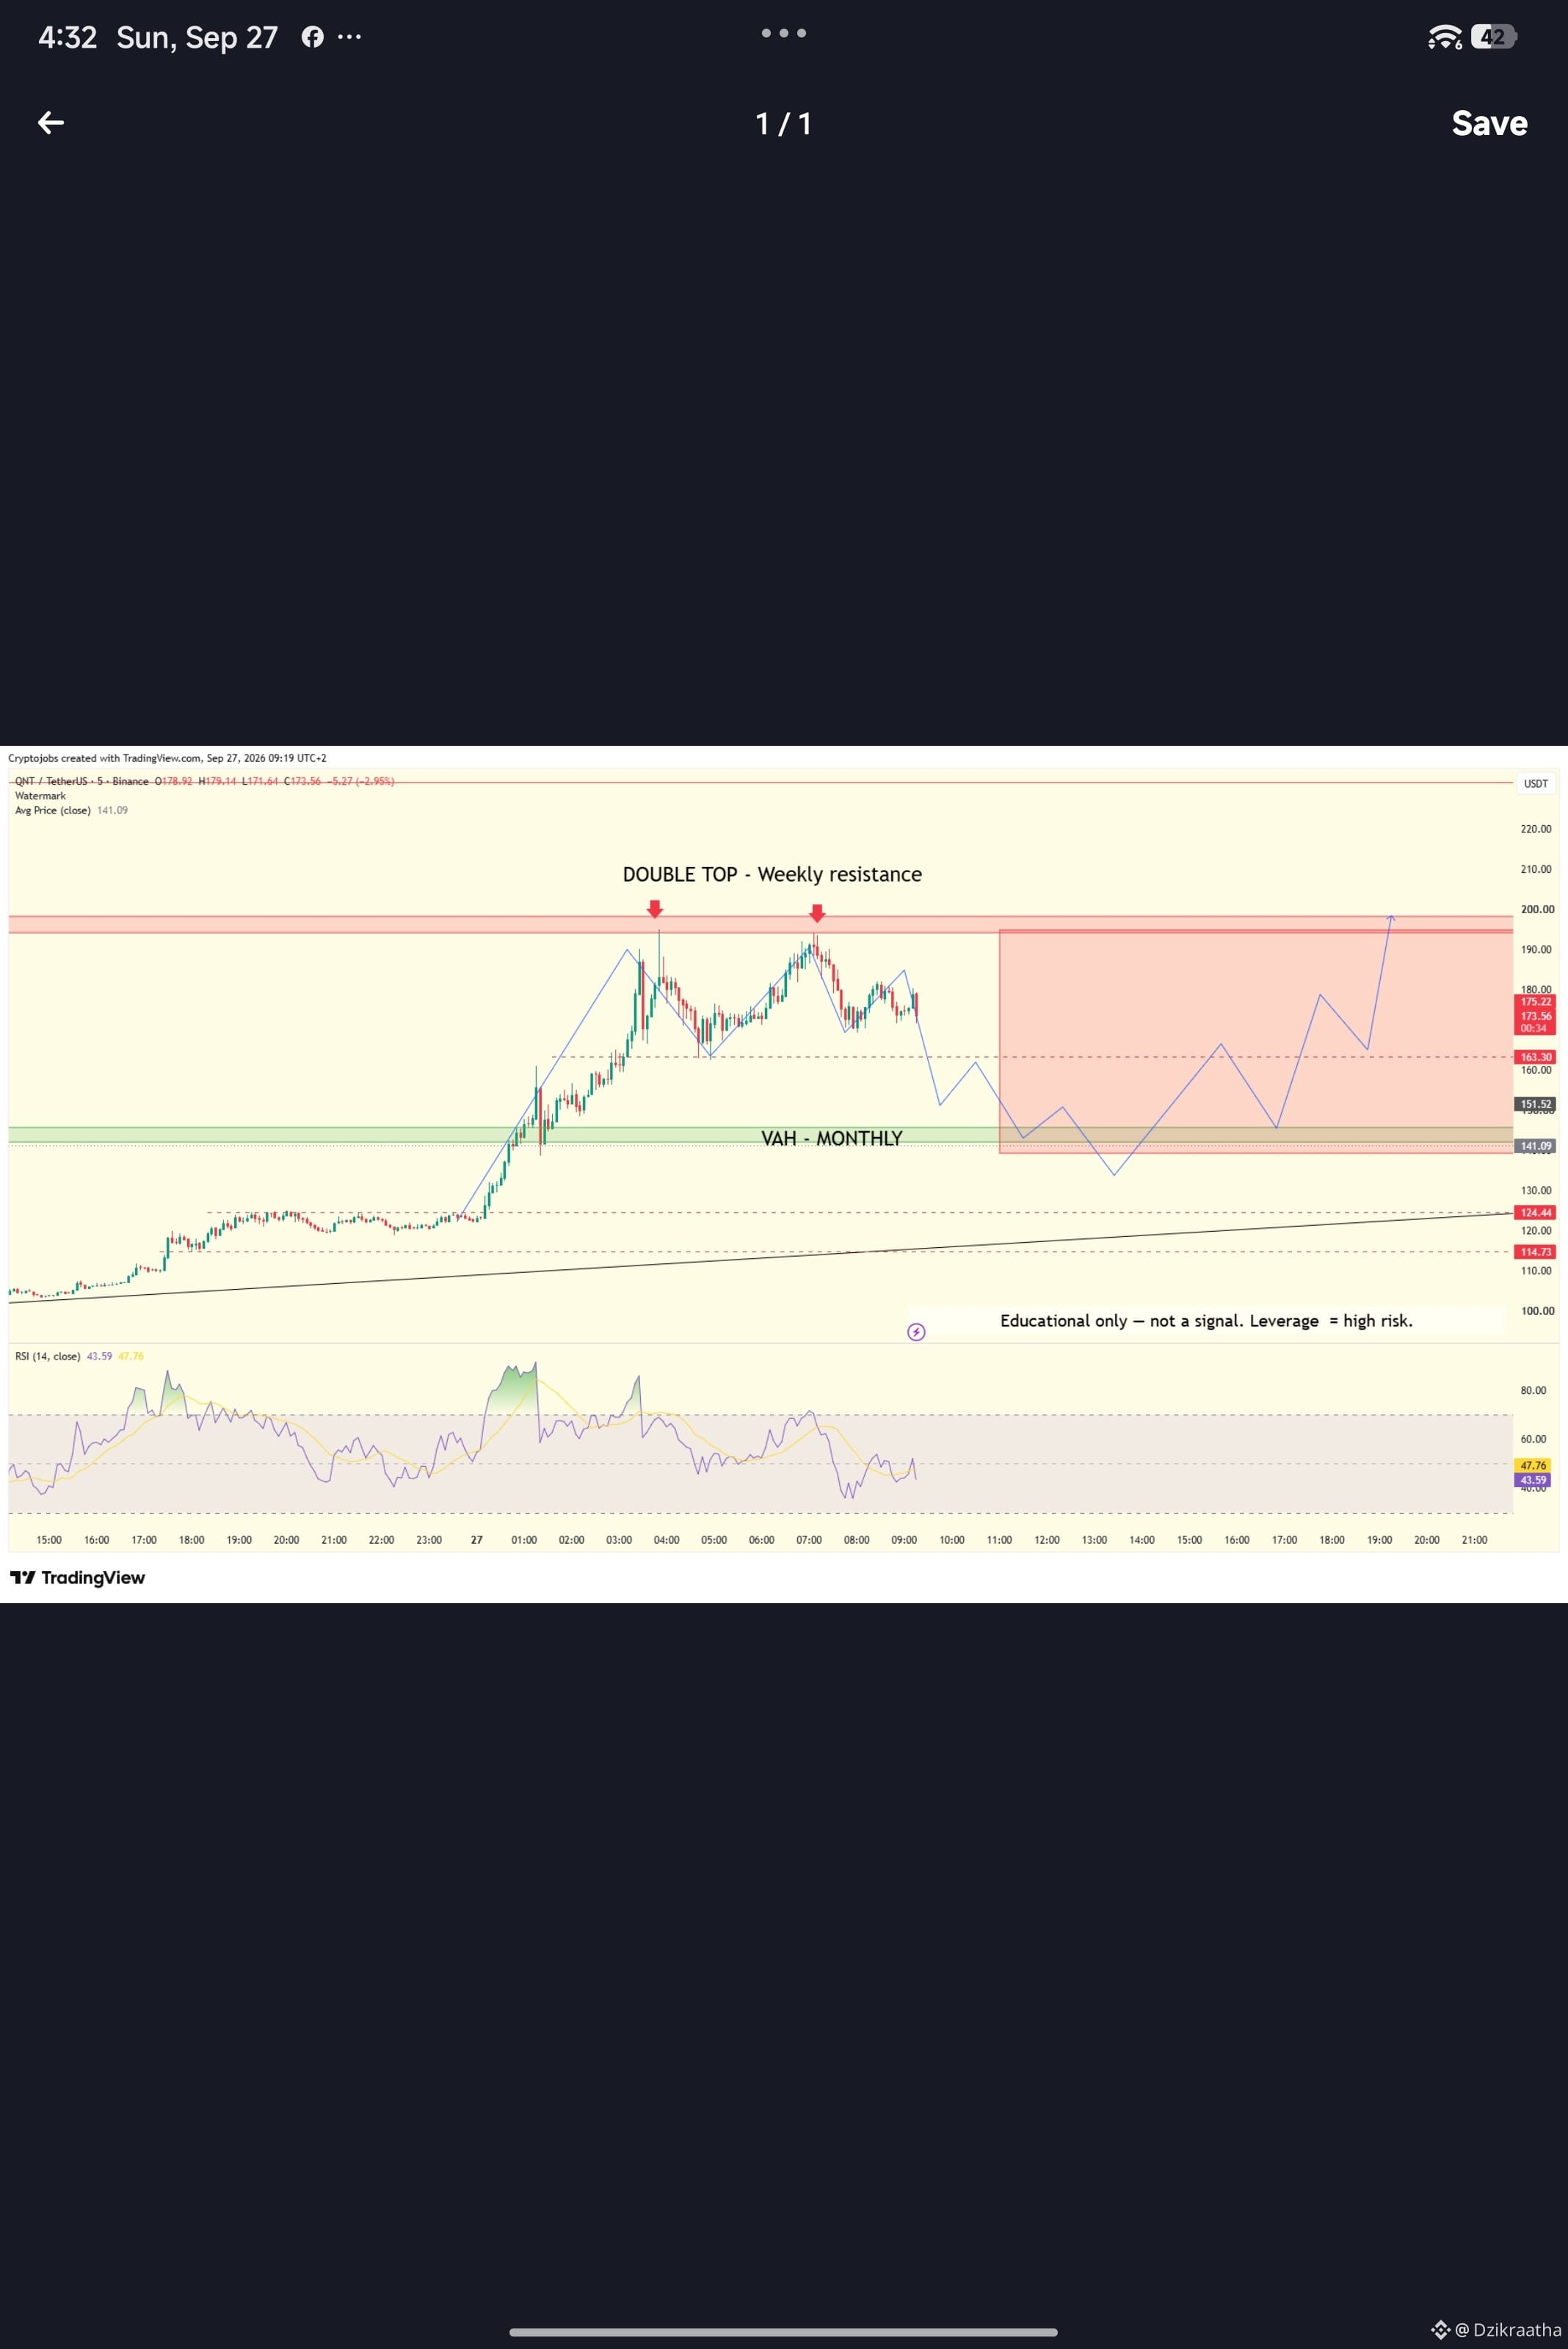
📉 QNT/USDT — Double Top at Weekly Resistance
QNT price structure is sending a classic signal: a Double Top in the weekly resistance area around ~$198-200. Two attempts to break out, two rejections at the same level—this usually indicates buyer exhaustion in that zone.
What to watch:
🔴 Weekly Resistance: ~198-200 (2x rejection)
🟡 Key Support: VAH Monthly ~141
📊 RSI (14): starting to fall from overbought; momentum weakens after the second top
Scenario:
If the VAH Monthly support (~141) breaks, there may be further correction toward lower areas before the trend resumes. But if price can hold above VAH and reclaim the level above it, this could be re-accumulation before the next leg.
⚠️ Disclaimer: This is purely for educational technical analysis, not a trading signal or an invitation to buy/sell. Leverage = high risk. Do your own research (DYOR) & manage your risk yourself.
#QNT #BinanceSquare #TechnicalAnalysis #DoubleTop
QNT price structure is sending a classic signal: a Double Top in the weekly resistance area around ~$198-200. Two attempts to break out, two rejections at the same level—this usually indicates buyer exhaustion in that zone.
What to watch:
🔴 Weekly Resistance: ~198-200 (2x rejection)
🟡 Key Support: VAH Monthly ~141
📊 RSI (14): starting to fall from overbought; momentum weakens after the second top
Scenario:
If the VAH Monthly support (~141) breaks, there may be further correction toward lower areas before the trend resumes. But if price can hold above VAH and reclaim the level above it, this could be re-accumulation before the next leg.
⚠️ Disclaimer: This is purely for educational technical analysis, not a trading signal or an invitation to buy/sell. Leverage = high risk. Do your own research (DYOR) & manage your risk yourself.
#QNT #BinanceSquare #TechnicalAnalysis #DoubleTop