



SUI’s coin behavior is truly excellent. This wave of main force is back again. The first step up from the bottom has already doubled.
It’s only just the beginning—small-cap altcoin bull energy has arrived, and SUI will not remain silent either.
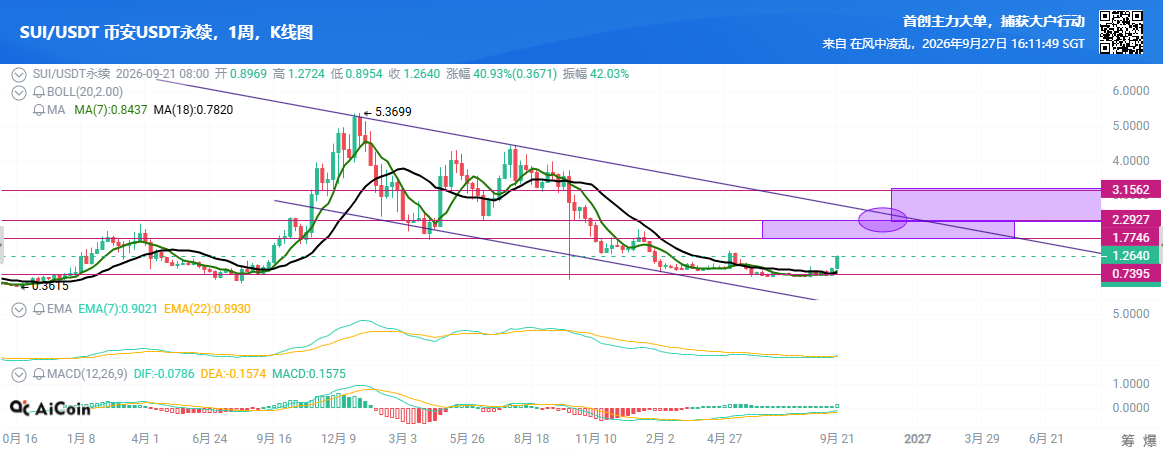
From the weekly chart, observing SUI: after starting a long-term downtrend from the high point 5.3699, it dipped to a low of 0.3615 and completed the formation of a major-level base. This week’s weekly candle surged with a big bullish candle, rising 40.87%. The price has moved above MA7 and MA18. The MACD green histogram has narrowed, and the DIF has turned upward. A turning point has appeared in the larger time-frame bearish trend. This round belongs to the start of the weekly-level upswing after the bottom of a bear market. The real fish body has not appeared yet.
There’s no brother who averaged in at the bottom. Still, there’s a very good chance. Averaging in at the bottom has low cost, but the timing is uncertain. This time is a deterministic spot opportunity. Not recommended to go long with contract leverage!!

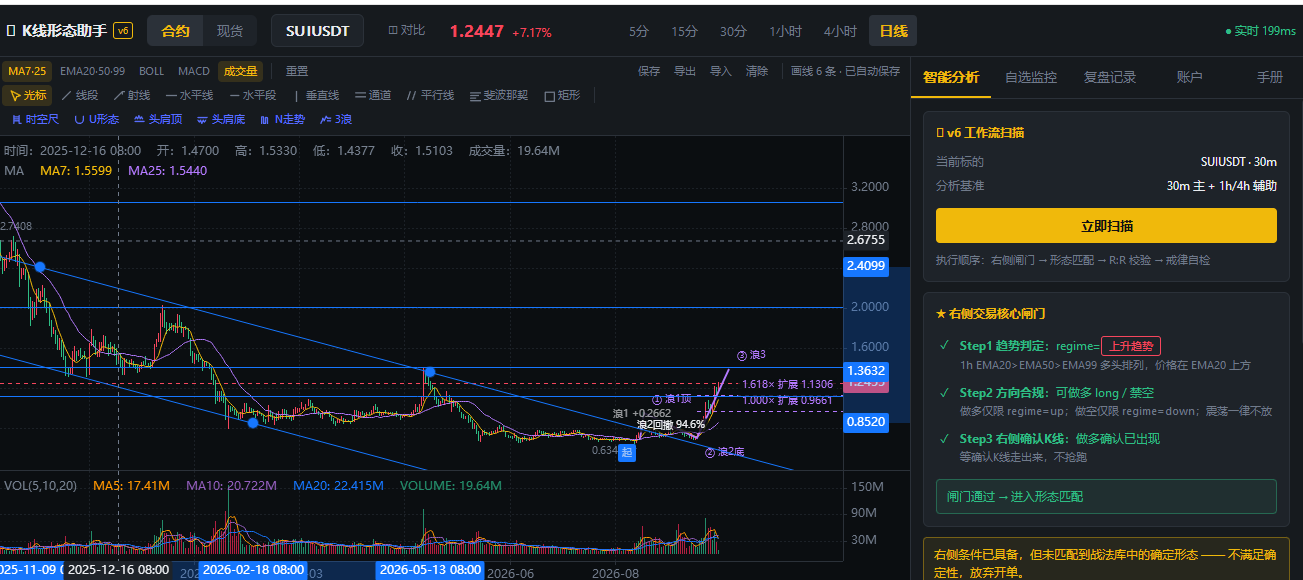
On the daily timeframe: price breaks above the long-term descending trendline. In the wave structure, Wave 2 bottoms at 0.634 and completes a deep retracement (retracement magnitude 94.6%). It’s now entering Wave 3—the main upswing. From a “right-side trend gate” perspective, the bullish environment has been confirmed. On the 1H chart, the moving averages are in a bullish alignment; price is holding above the EMA20, so the bullish structure is established. From the Chan theory perspective: at a higher level, the bearish trend has completed a first buy bottom formation. This current rally is the leaving phase after the daily-level first buy. In the short term, 1.42 and 1.5 are the prior neckline resistance zone and belong to the first type of resistance. Once broken, it will open up space above. The pullback comes in two stages: a strong pullback support at 1.15–1.20, which is a benign retracement that stays within the upper boundary of the daily center range; an extreme pullback around 0.96 is the golden add-on zone for the start of Wave 3. If it drops below 0.8520, the main upswing assumption is invalid.
Wyckoff distribution / accumulation theory: The prior long period of sideways movement at low levels is the stage where the big players accumulate. Near the end of the decline, a low-volume selling exhaustion appears. This week’s expansion with a large bullish candle is a marker that accumulation is finished (SOS—stop selling supply). Currently, the big players have not entered the distribution zone yet. Distribution typically happens in the high target range of 2.3–3.15. In that range, you’ll see distribution characteristics such as volume expansion with sluggish上涨, more upper wicks, and buyers’ exhaustion. At that time, you should gradually reduce your position.
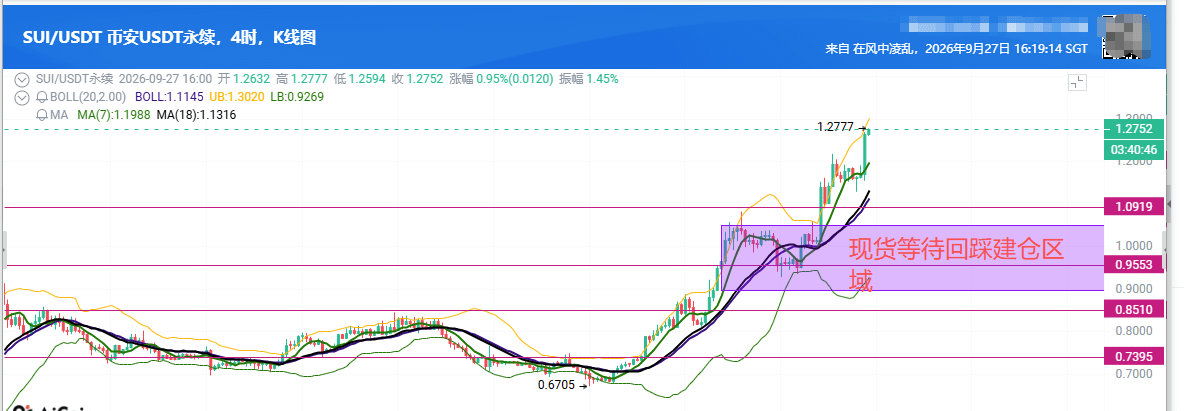
Target projection: first target 1.77, then 2.29, ultimate target 3.15. Near-term neckline resistance is 1.42–1.5. In that area, sideways movement with a pullback is likely, so it’s not advisable to chase. Spot is suitable for building a base in batches on pullbacks.
Risk warning: Cryptocurrency volatility is extremely high. Technical analysis is only a personal probability projection and not a guaranteed outcome. This main uptrend thesis can be disproven; macro liquidity changes, sudden changes in project fundamentals, and black swan events can all alter the market. Be sure to manage your position size, don’t over-allocate, and set stop-loss levels.
The wind in the mountains 2026/9/27