Xingran Next Week Gold Market Analysis (2026.9.27)
After the Fed’s September rate hike was implemented, hawkish signals continued to ferment. The dot plot suggests that another rate hike may still occur within the year, with the probability of a rate hike in October staying around 67.5%. The US Dollar Index remains above 101, while the 10-year US Treasury yield hovers around the 5.1% area. The high-interest-rate environment continues to weigh on non-yielding assets.
The structural demand for gold ETFs—“buying more as prices fall”—still remains. The logic behind central bank gold purchases is unchanged, but in the short term it is difficult to reverse the weak trend.
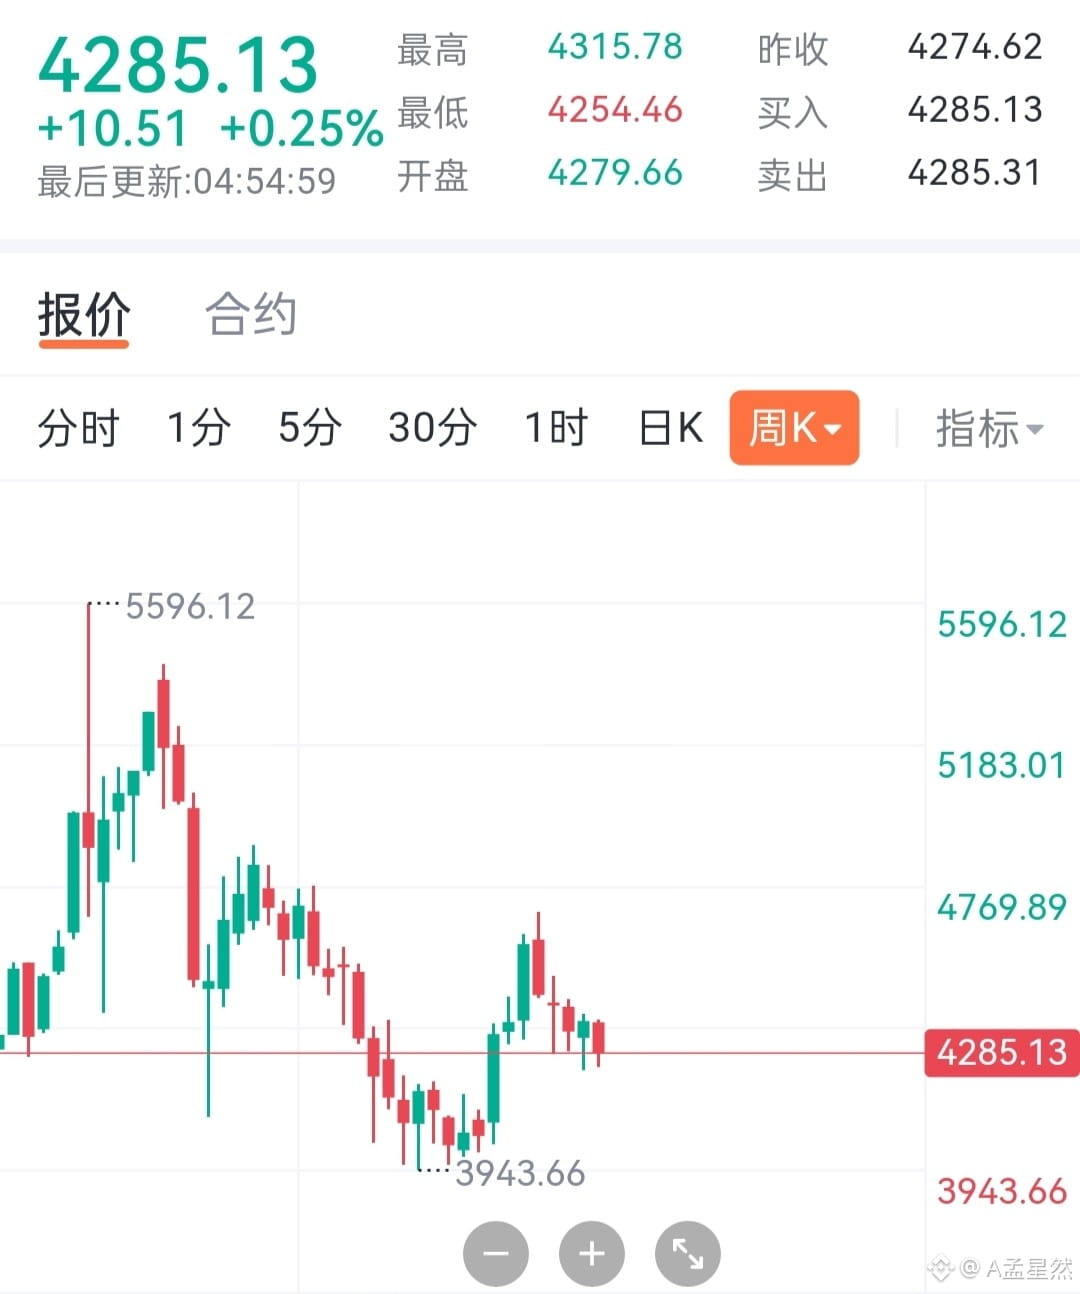
After the prior high on the weekly chart at 5596.12, a clear downtrend followed. After rebounding and repairing from 3943.66, it faced renewed pressure and fell again. The current price is 4285.13. The rebound has not broken through the weekly-level resistance, and the broader bearish structure is still intact.
Strategy Reference
Resistance zone: 4470–4500
Support: 3943
Invalidation line: 4550
Entry: Build short positions when the price rebounds toward the resistance area. Stop loss: above 4550. First target: 4100. Second target: test around 3943.
Summary
At the weekly level, the broader cycle trade remains bearish and unchanged. Rebound pressure in the 4470–4500 range presents a high-short opportunity, with targets looking down at 4100 → 3943. If the weekly close holds above 4550, the bearish thesis is invalidated and the outlook shifts to consolidation with a slight bullish bias. Strictly control position sizing.$XAU #Polymarket银行倒闭押注引FDIC关注 #Circle在Solana增发5亿枚USDC
After the Fed’s September rate hike was implemented, hawkish signals continued to ferment. The dot plot suggests that another rate hike may still occur within the year, with the probability of a rate hike in October staying around 67.5%. The US Dollar Index remains above 101, while the 10-year US Treasury yield hovers around the 5.1% area. The high-interest-rate environment continues to weigh on non-yielding assets.
The structural demand for gold ETFs—“buying more as prices fall”—still remains. The logic behind central bank gold purchases is unchanged, but in the short term it is difficult to reverse the weak trend.
After the prior high on the weekly chart at 5596.12, a clear downtrend followed. After rebounding and repairing from 3943.66, it faced renewed pressure and fell again. The current price is 4285.13. The rebound has not broken through the weekly-level resistance, and the broader bearish structure is still intact.
Strategy Reference
Resistance zone: 4470–4500
Support: 3943
Invalidation line: 4550
Entry: Build short positions when the price rebounds toward the resistance area. Stop loss: above 4550. First target: 4100. Second target: test around 3943.
Summary
At the weekly level, the broader cycle trade remains bearish and unchanged. Rebound pressure in the 4470–4500 range presents a high-short opportunity, with targets looking down at 4100 → 3943. If the weekly close holds above 4550, the bearish thesis is invalidated and the outlook shifts to consolidation with a slight bullish bias. Strictly control position sizing.$XAU #Polymarket银行倒闭押注引FDIC关注 #Circle在Solana增发5亿枚USDC