The reported perpetual positions share of #Hyperliquid #合约市场 $HYPE has risen to about 11.4%. I understand that the platform is gaining more open positions, but I don’t agree with translating this single number directly into the idea that trading volume shares or token value have benefited at the same time—between these three layers, there’s also execution and fees.
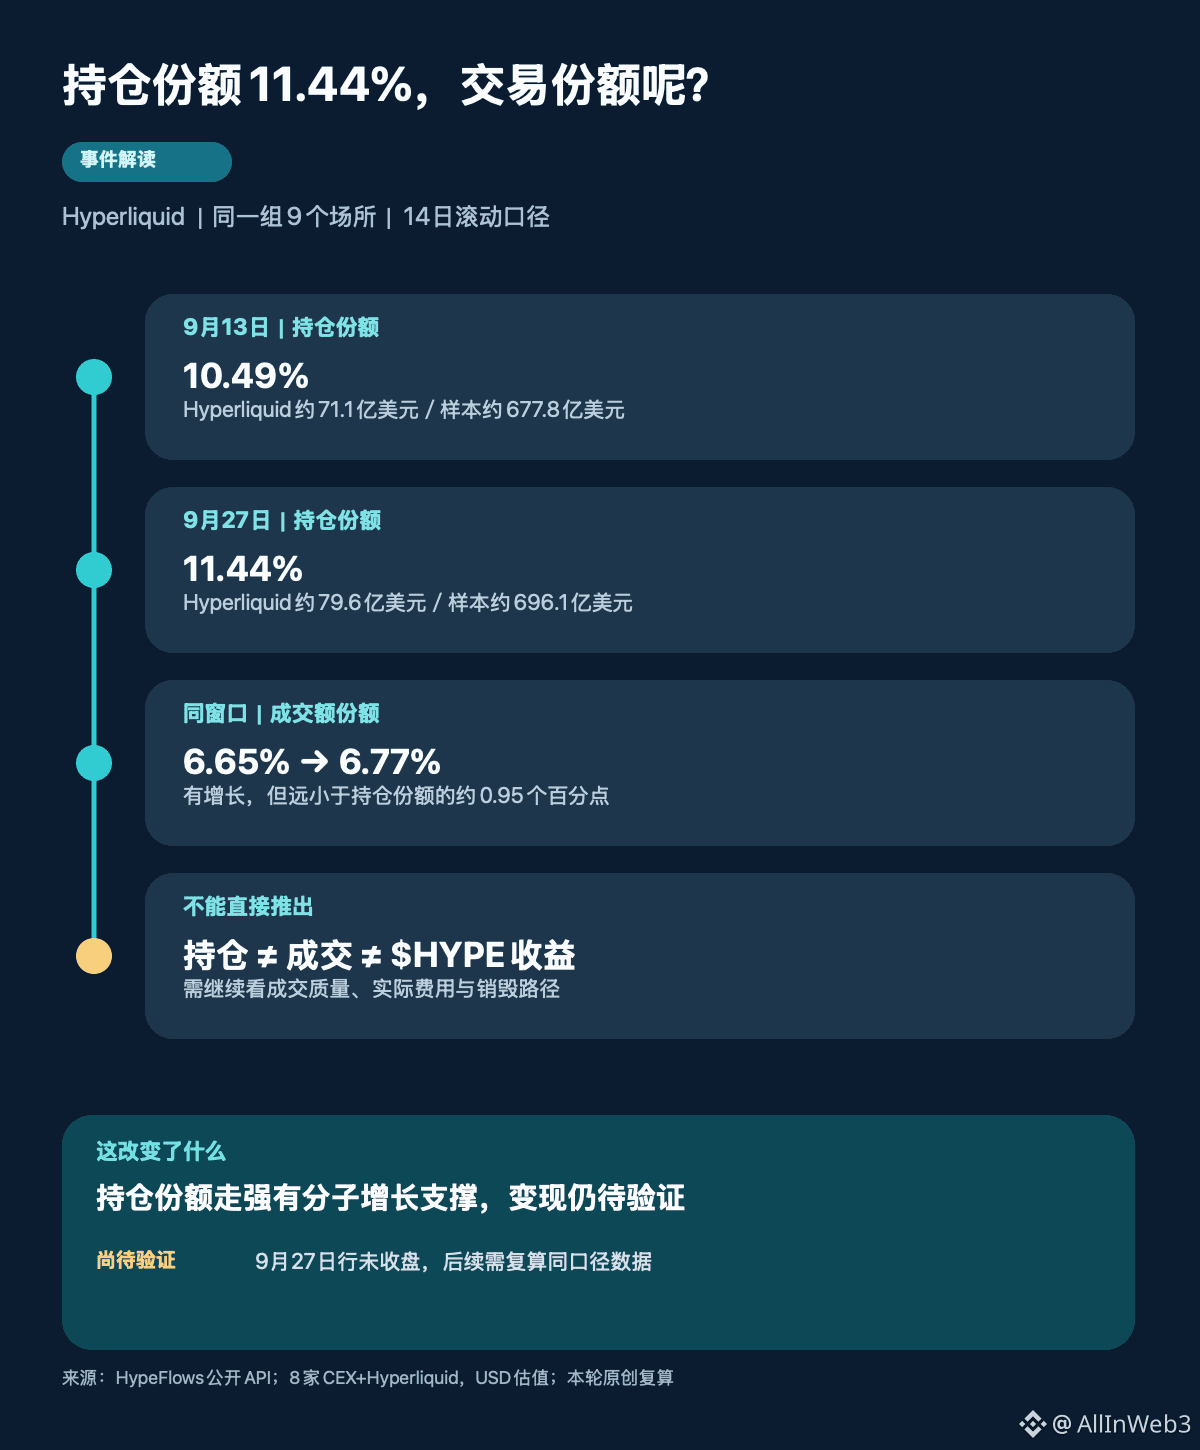
The news flash around 13:44 today points to HypeFlows. Based on its publicly available data, for the same set of Hyperliquid versus eight additional centralized exchange platforms, I recalculated the 14-day rolling window: on September 13, Hyperliquid’s average position value was about $7.11 billion, accounting for roughly 10.49% of the sample; on September 27, it was about $7.96 billion, or 11.44%. The share increased by about 0.95 percentage points. The numerator rose by roughly 12%, while the sample’s total open positions grew by only about 2.7%, so this isn’t a “paper share” created merely because other platforms’ positions shrank.
But the second table is about something else. For the same set of venues and the same 14-day window, Hyperliquid’s perpetual trading volume share rose from about 6.65% to 6.77%, an increase of roughly 0.12 percentage points. Its average daily trading volume is also growing—from about $7.4 billion to $8.9 billion; it’s just that the sample’s overall trading volume expanded in parallel. The positions share running ahead of the trading volume share could mean positions are being held longer, or that the product or leverage structure differs. With only two aggregated curves, you can’t determine which one.
This is the core of my judgment about this news: Hyperliquid’s contract competitiveness has made real progress, but “more positions” doesn’t yet mean “improved revenue quality in parallel.” Open interest is the stock of long and short contracts still present on the book at a given time—not the number of new users, and not net inflows. Fees mainly relate to actual trading. Hyperliquid’s official rules also distinguish between market-making rebates, HLP, the Assistance Fund, and deployer splits. Portions going into the Assistance Fund are automatically converted to $HYPE and then burned, but you can’t estimate the burned amount directly from the position value.
I’ll continue to watch three signals that can be verified: whether the trading volume share keeps up on the same basis; whether actual fees and burn continue to increase; and whether liquidity and the ability to handle extreme market conditions improve as positions grow. The September 27 data row isn’t finished yet on that day, and may be revised afterward. So the so-called new highs are only “new highs” within the venues and scope covered by this data source.
If going forward the positions share stabilizes at 11% or higher, while the trading volume share remains around 7% and actual fees don’t rise in sync—would you interpret that as a stronger trading platform, or as a more crowded leveraged venue?
The news flash around 13:44 today points to HypeFlows. Based on its publicly available data, for the same set of Hyperliquid versus eight additional centralized exchange platforms, I recalculated the 14-day rolling window: on September 13, Hyperliquid’s average position value was about $7.11 billion, accounting for roughly 10.49% of the sample; on September 27, it was about $7.96 billion, or 11.44%. The share increased by about 0.95 percentage points. The numerator rose by roughly 12%, while the sample’s total open positions grew by only about 2.7%, so this isn’t a “paper share” created merely because other platforms’ positions shrank.
But the second table is about something else. For the same set of venues and the same 14-day window, Hyperliquid’s perpetual trading volume share rose from about 6.65% to 6.77%, an increase of roughly 0.12 percentage points. Its average daily trading volume is also growing—from about $7.4 billion to $8.9 billion; it’s just that the sample’s overall trading volume expanded in parallel. The positions share running ahead of the trading volume share could mean positions are being held longer, or that the product or leverage structure differs. With only two aggregated curves, you can’t determine which one.
This is the core of my judgment about this news: Hyperliquid’s contract competitiveness has made real progress, but “more positions” doesn’t yet mean “improved revenue quality in parallel.” Open interest is the stock of long and short contracts still present on the book at a given time—not the number of new users, and not net inflows. Fees mainly relate to actual trading. Hyperliquid’s official rules also distinguish between market-making rebates, HLP, the Assistance Fund, and deployer splits. Portions going into the Assistance Fund are automatically converted to $HYPE and then burned, but you can’t estimate the burned amount directly from the position value.
I’ll continue to watch three signals that can be verified: whether the trading volume share keeps up on the same basis; whether actual fees and burn continue to increase; and whether liquidity and the ability to handle extreme market conditions improve as positions grow. The September 27 data row isn’t finished yet on that day, and may be revised afterward. So the so-called new highs are only “new highs” within the venues and scope covered by this data source.
If going forward the positions share stabilizes at 11% or higher, while the trading volume share remains around 7% and actual fees don’t rise in sync—would you interpret that as a stronger trading platform, or as a more crowded leveraged venue?