#QNT/USDT
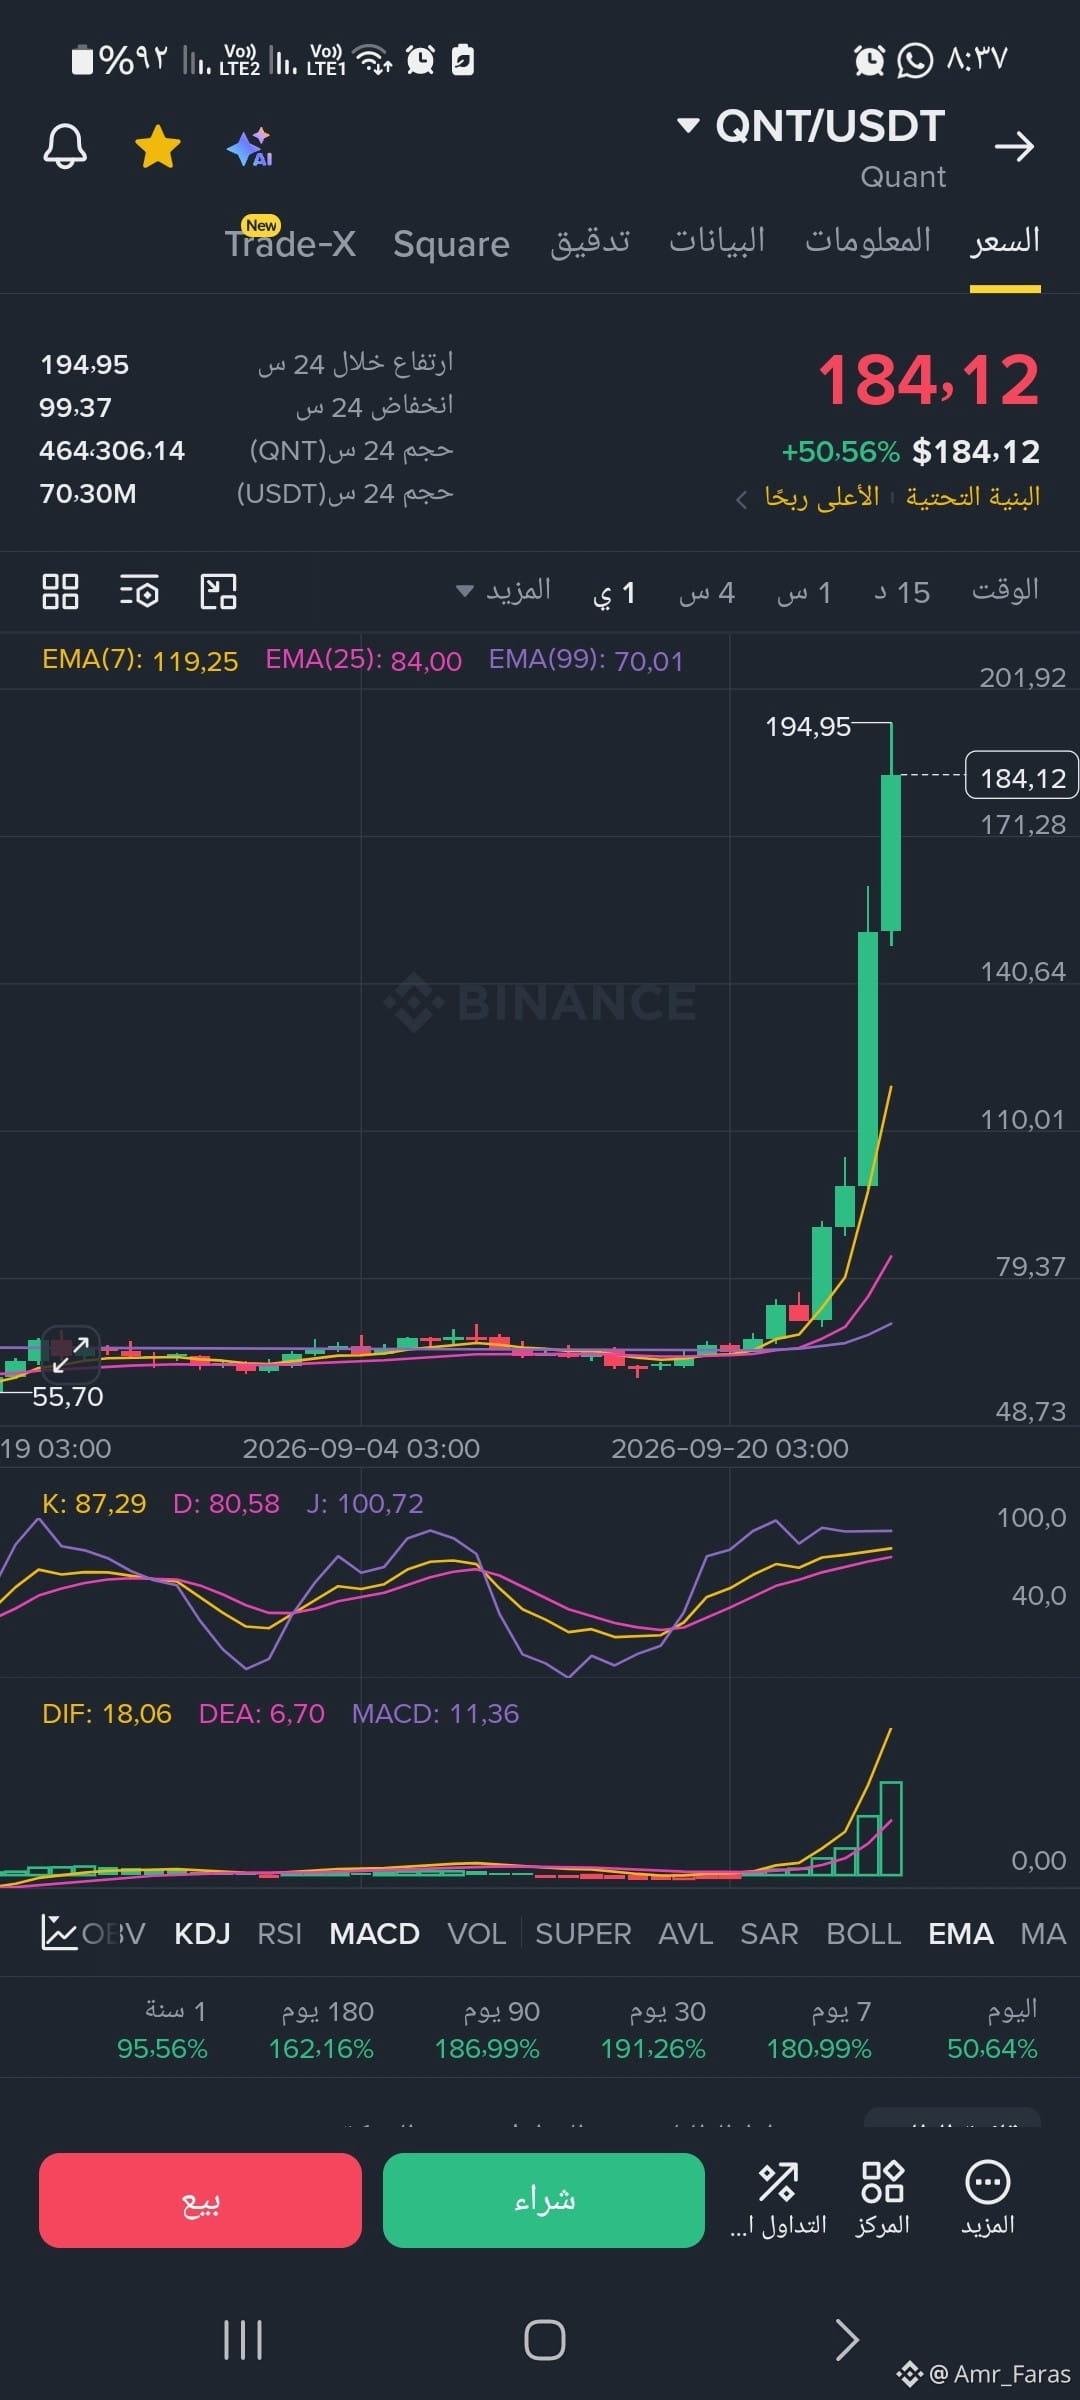
📉 KDJK Indicator: 87.29 | D: 80.58 | J: 100.72
Analysis: The indicator is fully trading within the extremely overbought (Overbought) zones. Specifically, when the J line reaches 100.72, it issues a warning signal indicating a likely near-term cooldown or pullback to offload these inflated indicators.
💡 Key Support and Resistance Levels
Near Resistance: 194.95 level (the highest point reached by the upper tail of the current candle).
First Support: The 140.64 to 119.25 zone (previous broken resistance levels and the location of the 7 EMA average).
📉 KDJK Indicator: 87.29 | D: 80.58 | J: 100.72
Analysis: The indicator is fully trading within the extremely overbought (Overbought) zones. Specifically, when the J line reaches 100.72, it issues a warning signal indicating a likely near-term cooldown or pullback to offload these inflated indicators.
💡 Key Support and Resistance Levels
Near Resistance: 194.95 level (the highest point reached by the upper tail of the current candle).
First Support: The 140.64 to 119.25 zone (previous broken resistance levels and the location of the 7 EMA average).