🚀 BITCOIN IN A CONSOLIDATION ZONE: SUPPORT AND KEY TREND! ⚡
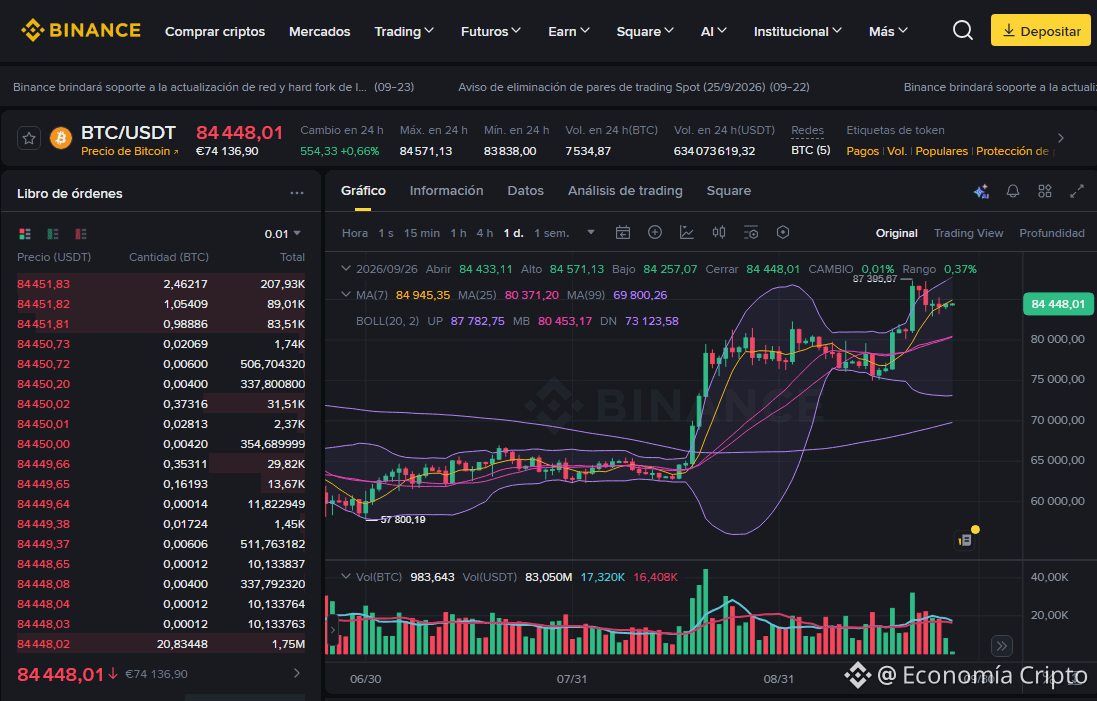
The BTC/USDT pair is trading at 84,448.01, recording a +0.66% change over the last 24 hours. The daily session shows an open at 84,433.11, a high of 84,571.13, a low of 83,838.00, and a close of 84,448.01 (+0.01%), reflecting a pause and technically consolidating phase in the market.
🔍 Trend Analysis and Indicators
Trend: Sideways-to-bullish in the short term, within a strong bullish macro structure at the base.
Moving Averages: Price is very close, slightly below the MA(7) (84,945.35), but holds firm above the MA(25) (80,371.20) and the long-term trend supported by the MA(99) (69,800.26).
Bollinger Bands: Price is oscillating after pulling back from the upper UP band (87,782.75), seeking stability near the middle MB band (80,453.17), with the lower band at DN (73,123.58).
Key Levels: Immediate support is in the 83,838.00 - 84,257.07 area, while the main resistance to break lies at the recent highs of 84,571.13 - 87,782.75.
💡 Trading Strategy: Buy or Sell?
Buy (Long)?: Stability above the medium-term moving averages offers a tactical accumulation opportunity at supports, with strict risk management.
Sell (Short)?: Going short implies higher risk due to the strength of the main trend; it would only be considered if there is a deep and sustained loss of the lower supports.
#Bitcoin #AnalisisTecnico #CryptoTrading
The Lord blesses and prospers the one who operates here, in the name of Jesus, because your word says: "The silver is mine, and the gold is mine," says the LORD of hosts. Hageo 2:8 RV1960-T -
$BTC
The BTC/USDT pair is trading at 84,448.01, recording a +0.66% change over the last 24 hours. The daily session shows an open at 84,433.11, a high of 84,571.13, a low of 83,838.00, and a close of 84,448.01 (+0.01%), reflecting a pause and technically consolidating phase in the market.
🔍 Trend Analysis and Indicators
Trend: Sideways-to-bullish in the short term, within a strong bullish macro structure at the base.
Moving Averages: Price is very close, slightly below the MA(7) (84,945.35), but holds firm above the MA(25) (80,371.20) and the long-term trend supported by the MA(99) (69,800.26).
Bollinger Bands: Price is oscillating after pulling back from the upper UP band (87,782.75), seeking stability near the middle MB band (80,453.17), with the lower band at DN (73,123.58).
Key Levels: Immediate support is in the 83,838.00 - 84,257.07 area, while the main resistance to break lies at the recent highs of 84,571.13 - 87,782.75.
💡 Trading Strategy: Buy or Sell?
Buy (Long)?: Stability above the medium-term moving averages offers a tactical accumulation opportunity at supports, with strict risk management.
Sell (Short)?: Going short implies higher risk due to the strength of the main trend; it would only be considered if there is a deep and sustained loss of the lower supports.
#Bitcoin #AnalisisTecnico #CryptoTrading
The Lord blesses and prospers the one who operates here, in the name of Jesus, because your word says: "The silver is mine, and the gold is mine," says the LORD of hosts. Hageo 2:8 RV1960-T -
$BTC