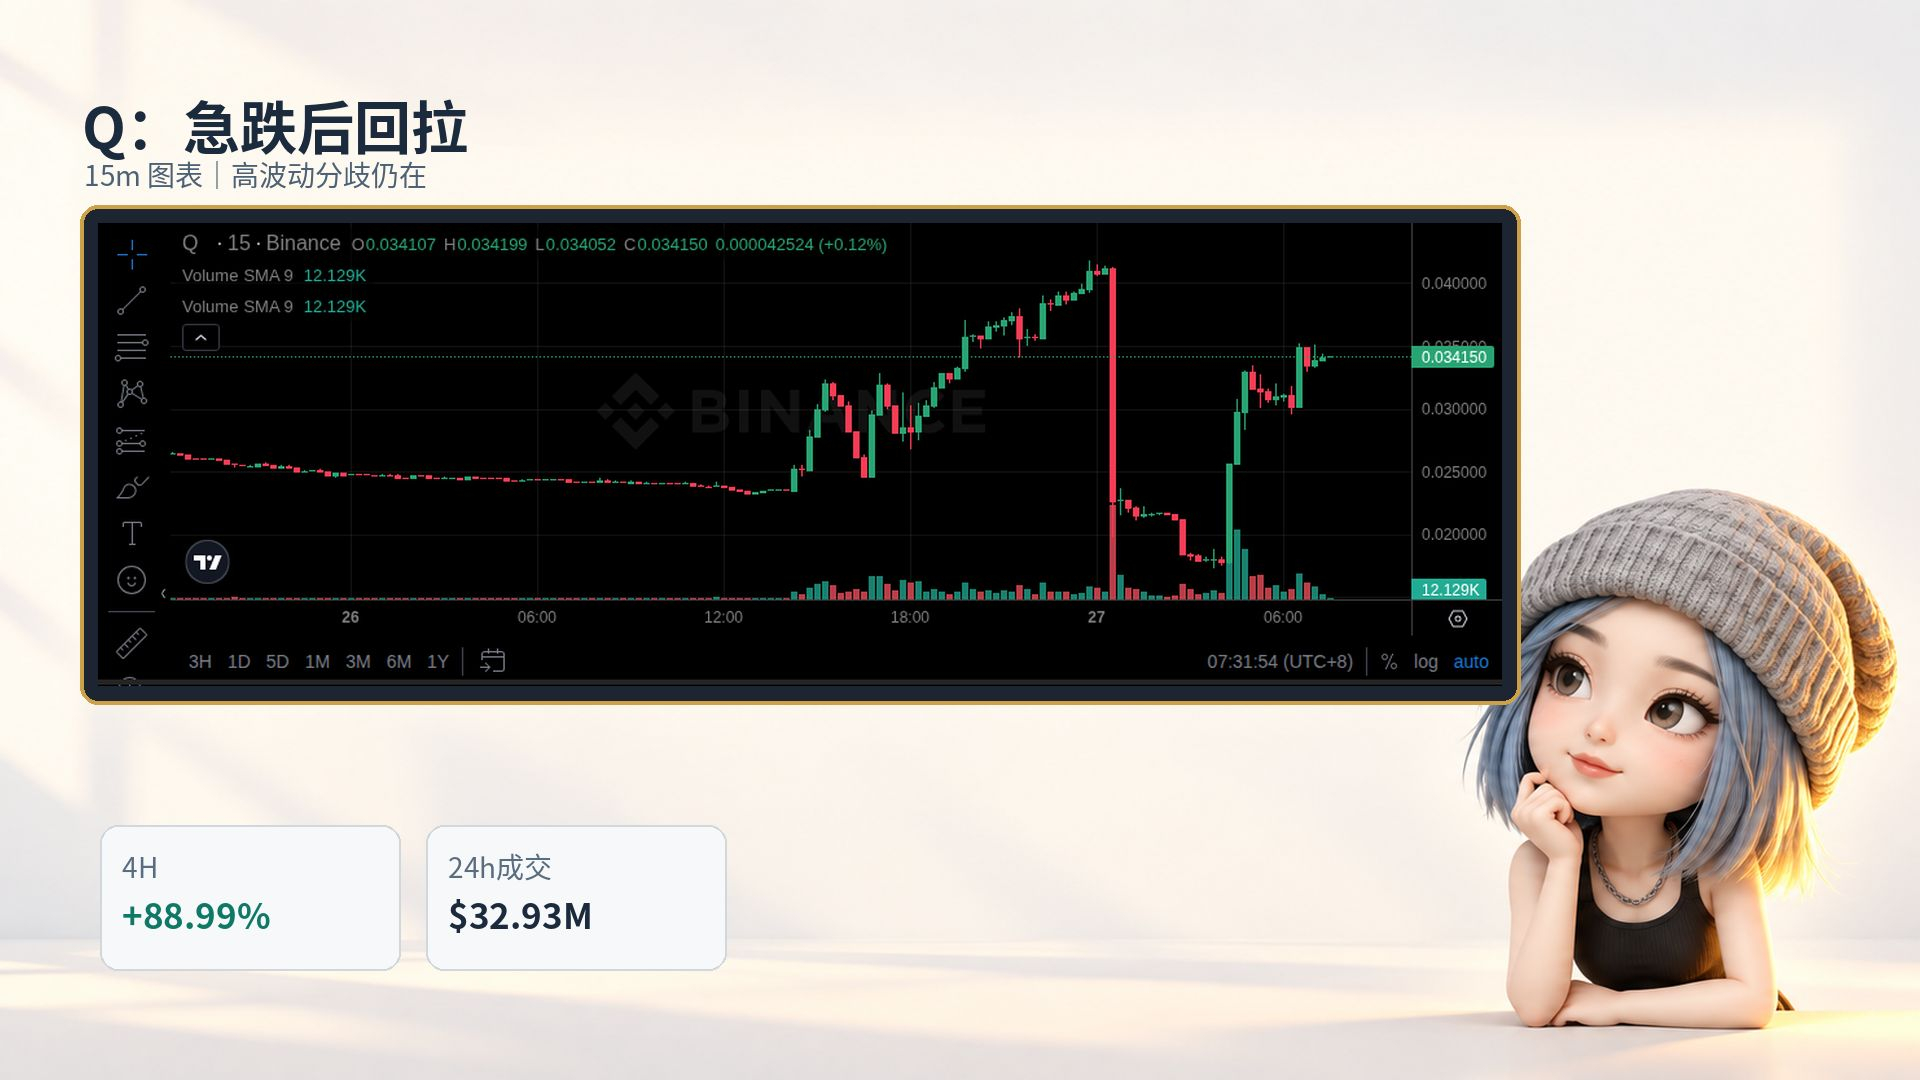

$Q This wave isn’t just a straight run-up—it first smashes down a big bearish candle, then gets quickly pulled back up.
The facts are right here: Q is up about +88.99% over the last 4 hours, and its 24-hour trading volume is around $32.93 million; on the 15-minute chart you can see the sharp drop, a second dip, and the rebound happening at the same time.
I’ll treat this as a high-volatility divergence/consolidation setup, not take a single pullback-and-rebound as trend confirmation. If the rebound can’t hold above key levels, and trading volume also shrinks, the repaired sentiment can easily flip again.
The audit is medium risk, with a note that more issuance could be added; 0 buy/sell tax doesn’t mean there’s no risk. You have to account for high volatility, chasing highs followed by pullbacks, liquidity, and message/event reversals.
When you see a chart like this—“dump down and then pulled back up”—do you look for support and absorption first, or do you just avoid it?
$Q #BinanceAlpha #BNBChain
The facts are right here: Q is up about +88.99% over the last 4 hours, and its 24-hour trading volume is around $32.93 million; on the 15-minute chart you can see the sharp drop, a second dip, and the rebound happening at the same time.
I’ll treat this as a high-volatility divergence/consolidation setup, not take a single pullback-and-rebound as trend confirmation. If the rebound can’t hold above key levels, and trading volume also shrinks, the repaired sentiment can easily flip again.
The audit is medium risk, with a note that more issuance could be added; 0 buy/sell tax doesn’t mean there’s no risk. You have to account for high volatility, chasing highs followed by pullbacks, liquidity, and message/event reversals.
When you see a chart like this—“dump down and then pulled back up”—do you look for support and absorption first, or do you just avoid it?
$Q #BinanceAlpha #BNBChain