$DASH
📊 DASHUSDT | Key Technical Points
- Trend: 🟢 Upward in the medium term, with consolidation near the top.
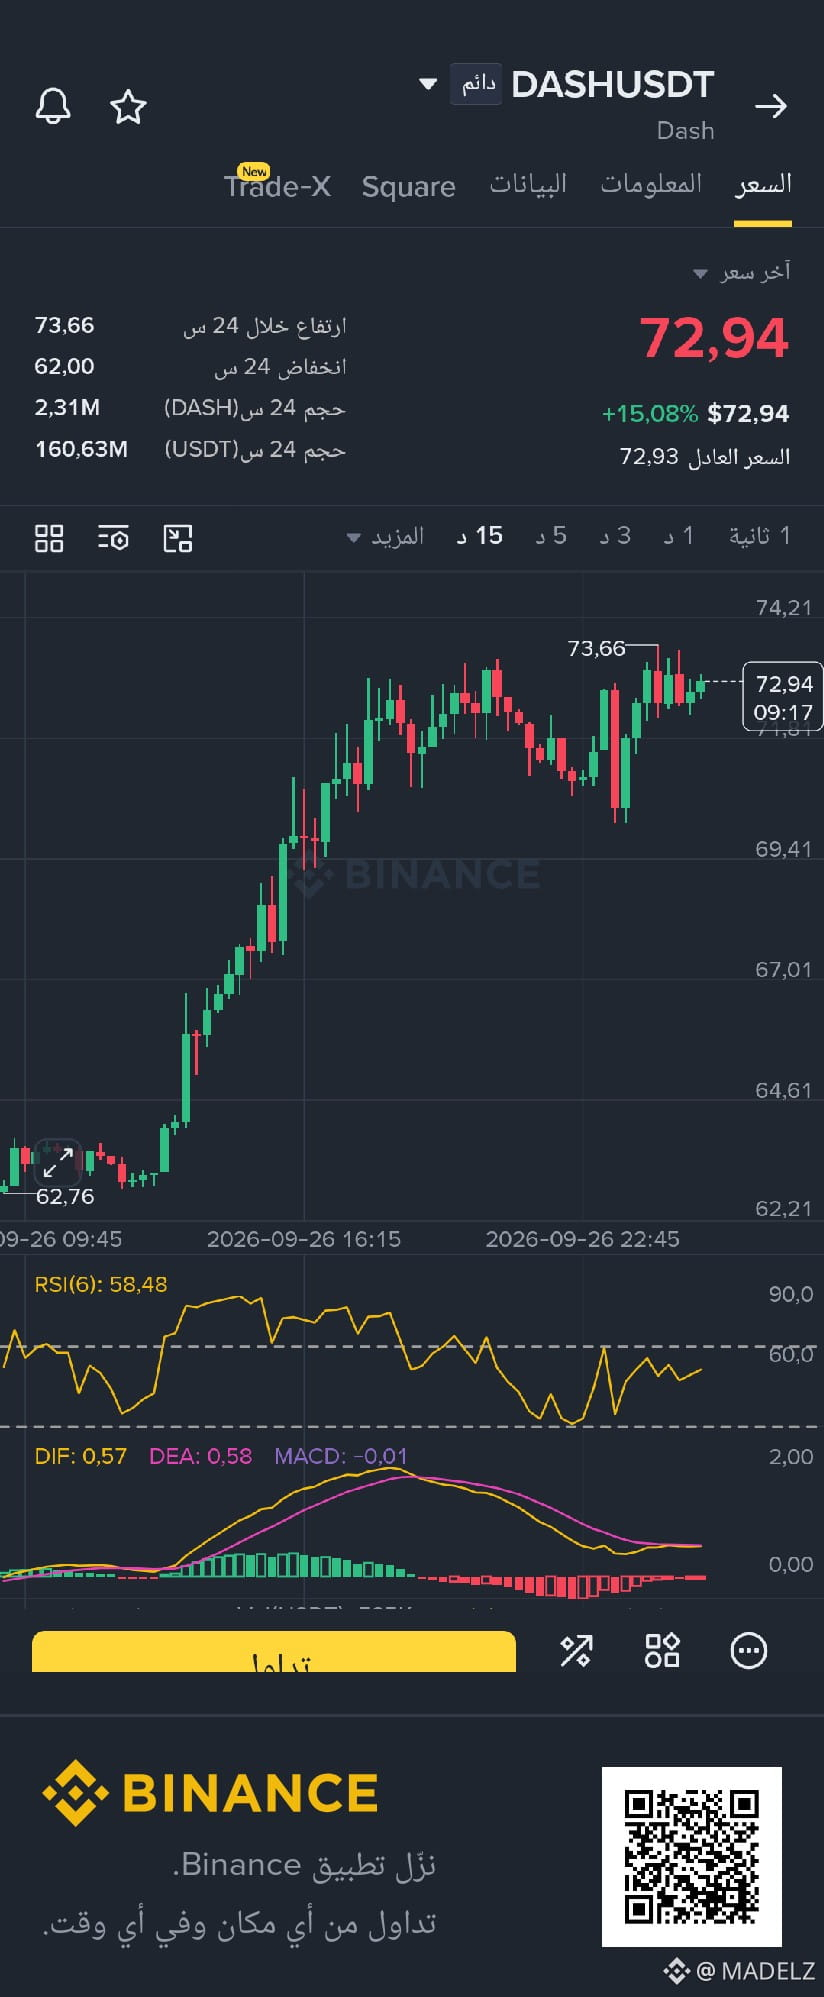
- Current situation: Tight fluctuation between 71.00 and 73.66 after a +15.08% rise.
🟢 Resistance
- 73.66: Current peak.
- 74.21: Next resistance.
- 75.00 - 76.00: Possible psychological zone.
🔴 Support zones
- 71.00: Current support and key pivot.
- 69.41: Next support.
- 67.01: Deeper support.
- 64.61: Major support and the start of the upward wave.
📈 Indicators
- RSI(6): 58.48, positive and above 50 without overbought.
- MACD: DIF 0.57 < DEA 0.58, with increasing red bars, indicating a temporary pause in momentum.
- Price action: Tight consolidation between 71.00 and 73.66.
🎯 Scenarios
🟢 Bullish scenario:
Holding above 71.00, then breaking 73.66 opens the way to 74.21; with continued momentum, the next area becomes 75.00 - 76.00.
🔴 Support-break scenario:
Breaking below 71.00 pushes the correction toward 69.41, then 67.01; breaking it opens the way to 64.61.
⚖️ Summary
The trend is still bullish, and RSI is in a positive zone without overbought, while MACD suggests a temporary pause in momentum. 73.66 is the key level to resume the uptrend, and 71.00 is the most important support level right now.
📊 DASHUSDT | Key Technical Points
- Trend: 🟢 Upward in the medium term, with consolidation near the top.
- Current situation: Tight fluctuation between 71.00 and 73.66 after a +15.08% rise.
🟢 Resistance
- 73.66: Current peak.
- 74.21: Next resistance.
- 75.00 - 76.00: Possible psychological zone.
🔴 Support zones
- 71.00: Current support and key pivot.
- 69.41: Next support.
- 67.01: Deeper support.
- 64.61: Major support and the start of the upward wave.
📈 Indicators
- RSI(6): 58.48, positive and above 50 without overbought.
- MACD: DIF 0.57 < DEA 0.58, with increasing red bars, indicating a temporary pause in momentum.
- Price action: Tight consolidation between 71.00 and 73.66.
🎯 Scenarios
🟢 Bullish scenario:
Holding above 71.00, then breaking 73.66 opens the way to 74.21; with continued momentum, the next area becomes 75.00 - 76.00.
🔴 Support-break scenario:
Breaking below 71.00 pushes the correction toward 69.41, then 67.01; breaking it opens the way to 64.61.
⚖️ Summary
The trend is still bullish, and RSI is in a positive zone without overbought, while MACD suggests a temporary pause in momentum. 73.66 is the key level to resume the uptrend, and 71.00 is the most important support level right now.