$BTC en $84K: Healthy consolidation before breaking resistance or a bullish trap?
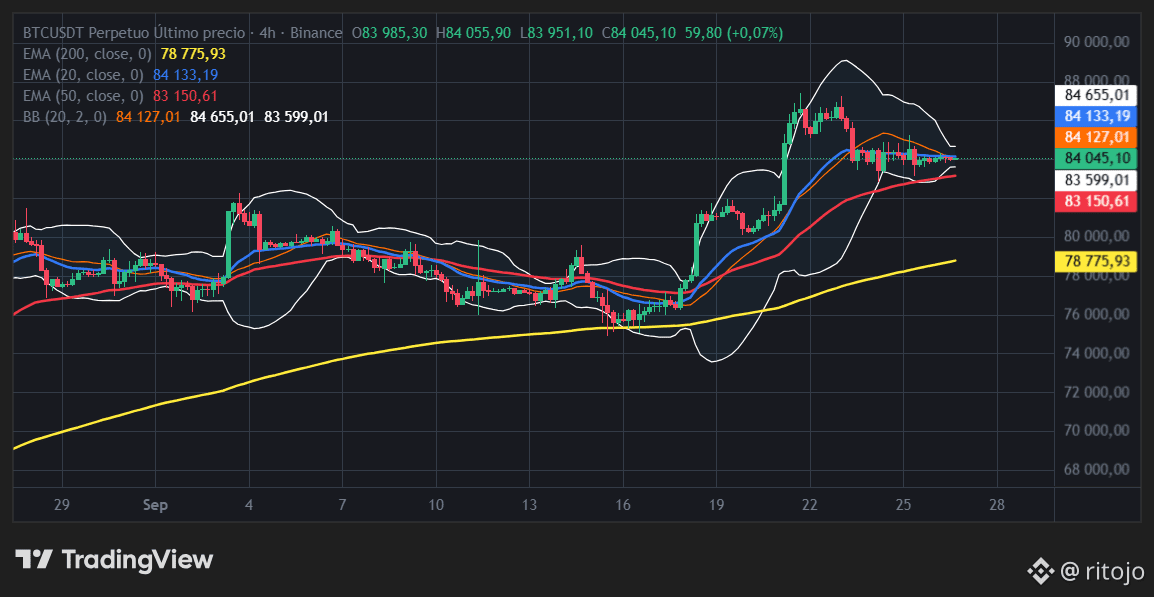
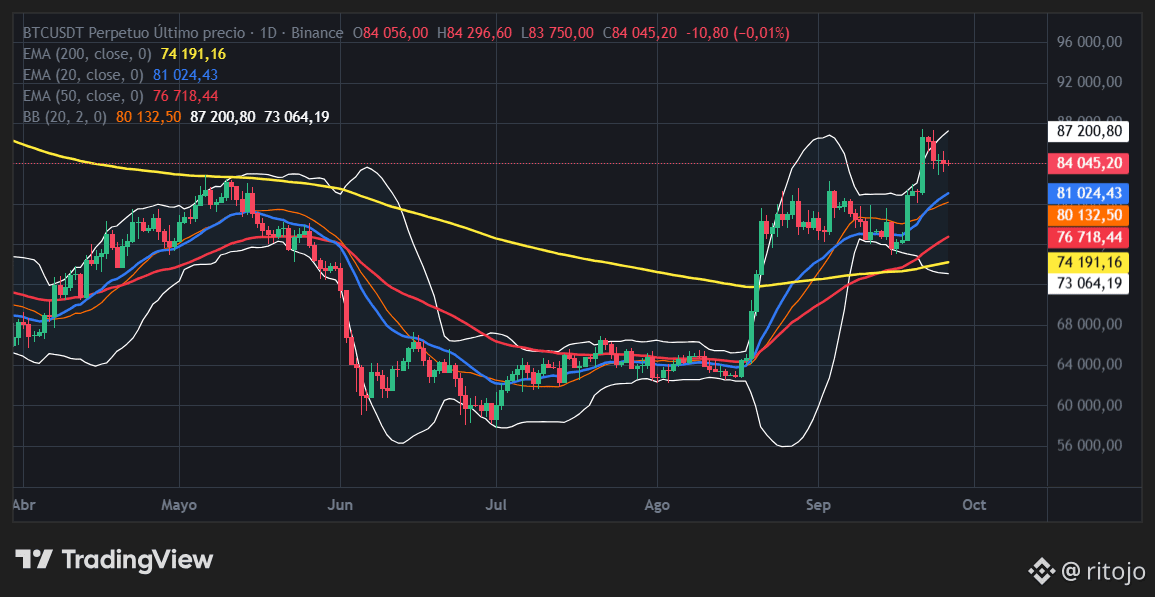
The market of $BTC is located in the $84,000 USD zone, showing a clear consolidation phase after the recent recovery. The technical structure presents key levels to monitor in the next hours:
🔹 Daily Structure: We maintain the uptrend trading above the main moving averages (EMA 20, 50, and 200).
🎯 Key Price Zones:
Immediate Resistance: $85,500 – $86,500 (Critical liquidation barrier for shorts).
Current Price: ~$84,050 (Accumulation midpoint).
Pivot Support: $82,100 – $83,700 (Liquidity retest zone).
Dynamic Support: $78,600 (Daily EMA 20).
📈 Bullish Scenario: A confirmed 4H chart close above $85,500 opens the direct path to seek liquidity toward the upper part of the channel.
📉 Bearish Scenario: Losing the $82,100 zone with selling volume could lead to a technical correction toward the EMA 20 near $78,600.
⚠️ The compression in the 4H Bollinger Bands suggests an imminent increase in volatility. Apply strict risk management and avoid overleveraging.
What do you think? Will we see $BTC break $86.5K this weekend, or will there be a retest of lower supports? 👇 Leave your analysis in the comments.
#bitcoin #CryptoAnalysis #TechnicalAnalysis #Write2Earn
The market of $BTC is located in the $84,000 USD zone, showing a clear consolidation phase after the recent recovery. The technical structure presents key levels to monitor in the next hours:
🔹 Daily Structure: We maintain the uptrend trading above the main moving averages (EMA 20, 50, and 200).
🎯 Key Price Zones:
Immediate Resistance: $85,500 – $86,500 (Critical liquidation barrier for shorts).
Current Price: ~$84,050 (Accumulation midpoint).
Pivot Support: $82,100 – $83,700 (Liquidity retest zone).
Dynamic Support: $78,600 (Daily EMA 20).
📈 Bullish Scenario: A confirmed 4H chart close above $85,500 opens the direct path to seek liquidity toward the upper part of the channel.
📉 Bearish Scenario: Losing the $82,100 zone with selling volume could lead to a technical correction toward the EMA 20 near $78,600.
⚠️ The compression in the 4H Bollinger Bands suggests an imminent increase in volatility. Apply strict risk management and avoid overleveraging.
What do you think? Will we see $BTC break $86.5K this weekend, or will there be a retest of lower supports? 👇 Leave your analysis in the comments.
#bitcoin #CryptoAnalysis #TechnicalAnalysis #Write2Earn