SOL/USDT CLASS: UNDERSTAND THE MOVE
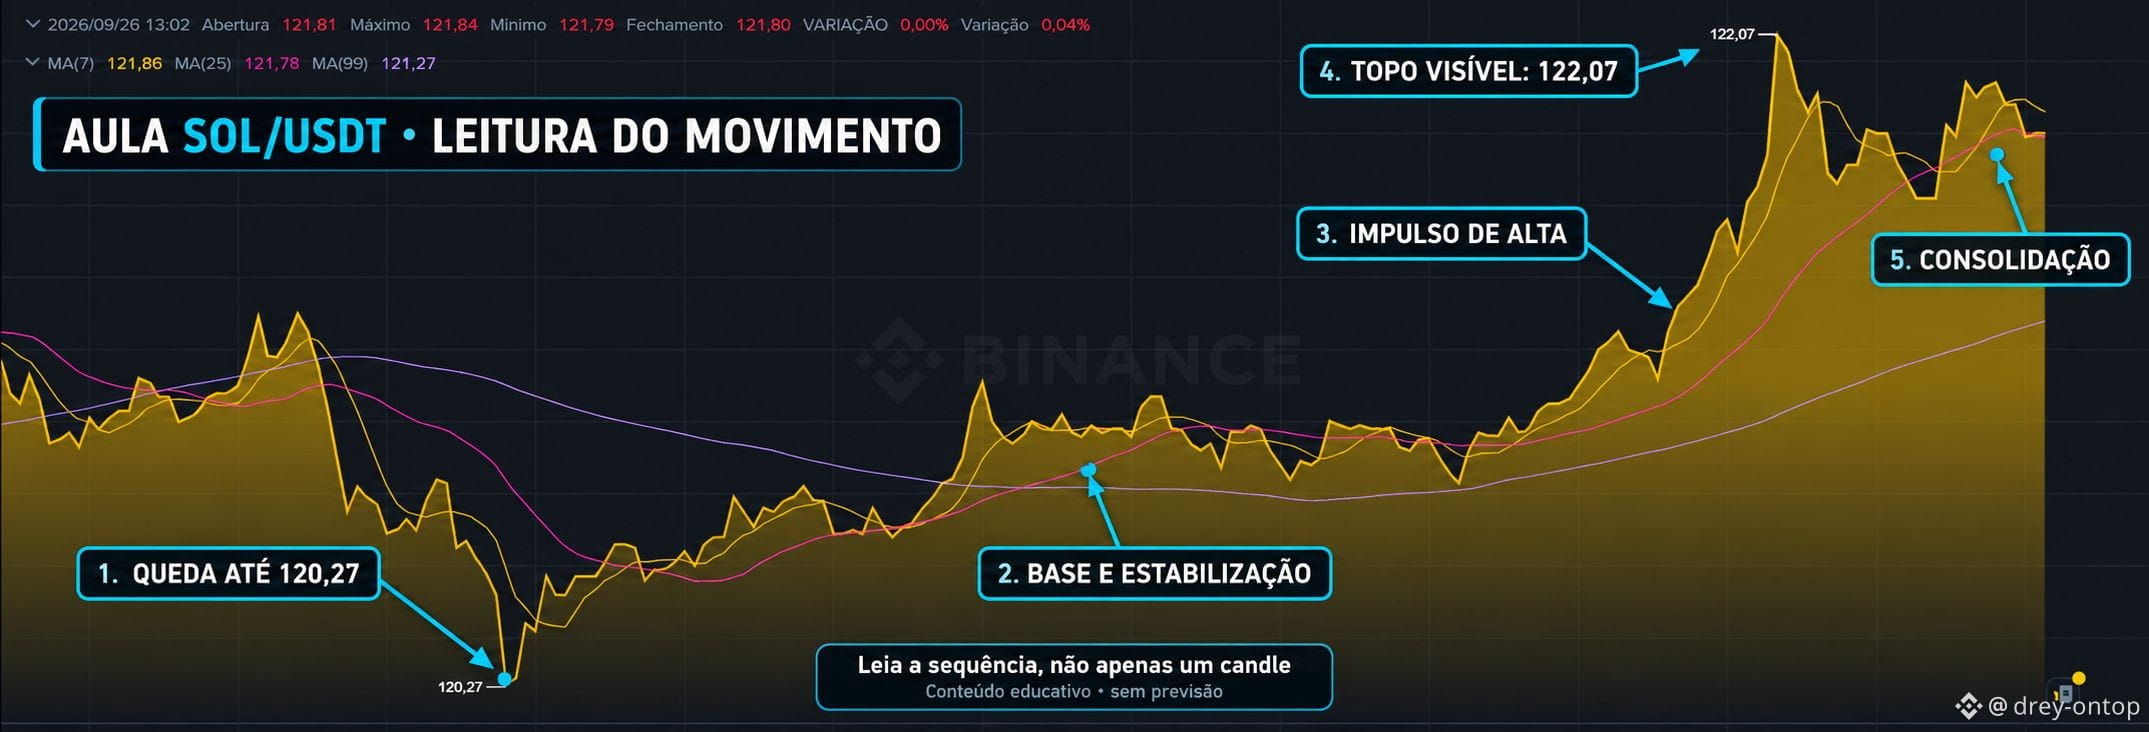
The chart shows a drop down to 120.27, followed by a stabilization phase. Then, the price gained strength, advanced to the highest visible point of 122.07, and started to oscillate near that top.
The key takeaway is not only the final high: it’s understanding the full sequence—from the drop, to the base formation, to the impulse, and then consolidation.
Look at the arrows in the image to follow each step
Will they manage to bring the SOL to the maximum again?
The chart shows a drop down to 120.27, followed by a stabilization phase. Then, the price gained strength, advanced to the highest visible point of 122.07, and started to oscillate near that top.
The key takeaway is not only the final high: it’s understanding the full sequence—from the drop, to the base formation, to the impulse, and then consolidation.
Look at the arrows in the image to follow each step
Will they manage to bring the SOL to the maximum again?