THE SCANNER UNDRESSED: Solana’s mathematical friction at $120
Solana trades at $120.87, caught in a millimeter-tight compression. Let’s run every metric through the microscope to reveal where institutional pressure is pointing.
Indicators Audit:
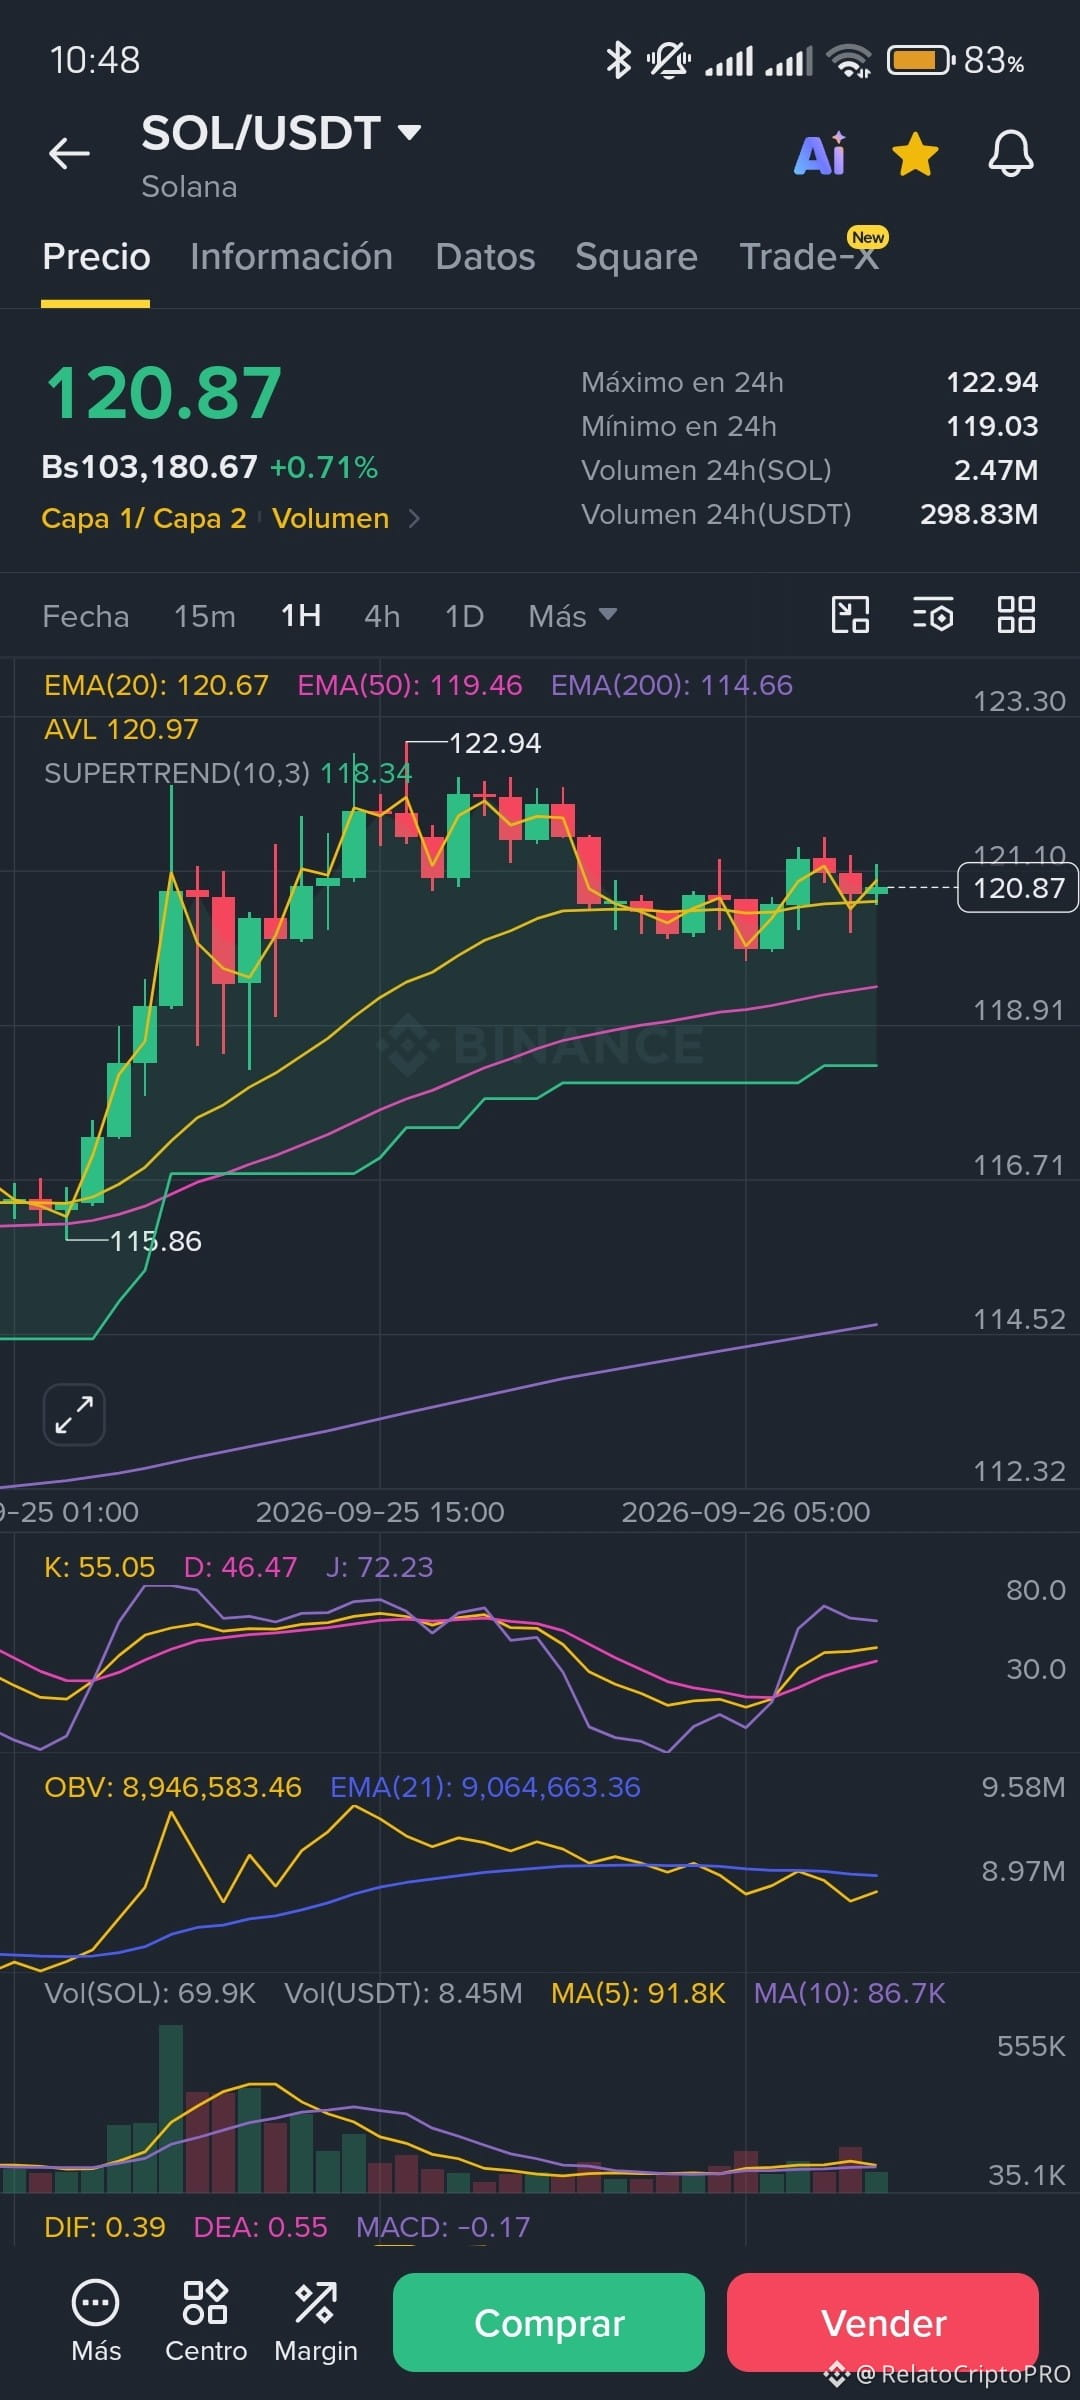
Gravity and EMAs: The price is literally encapsulated. On the 1H chart, SOL struggles to break above the Volume-Weighted Average Price (AVL) of $120.97, but immediately finds dynamic support in the 20 EMA at $120.67. It’s a near-choking range of just 30 cents.
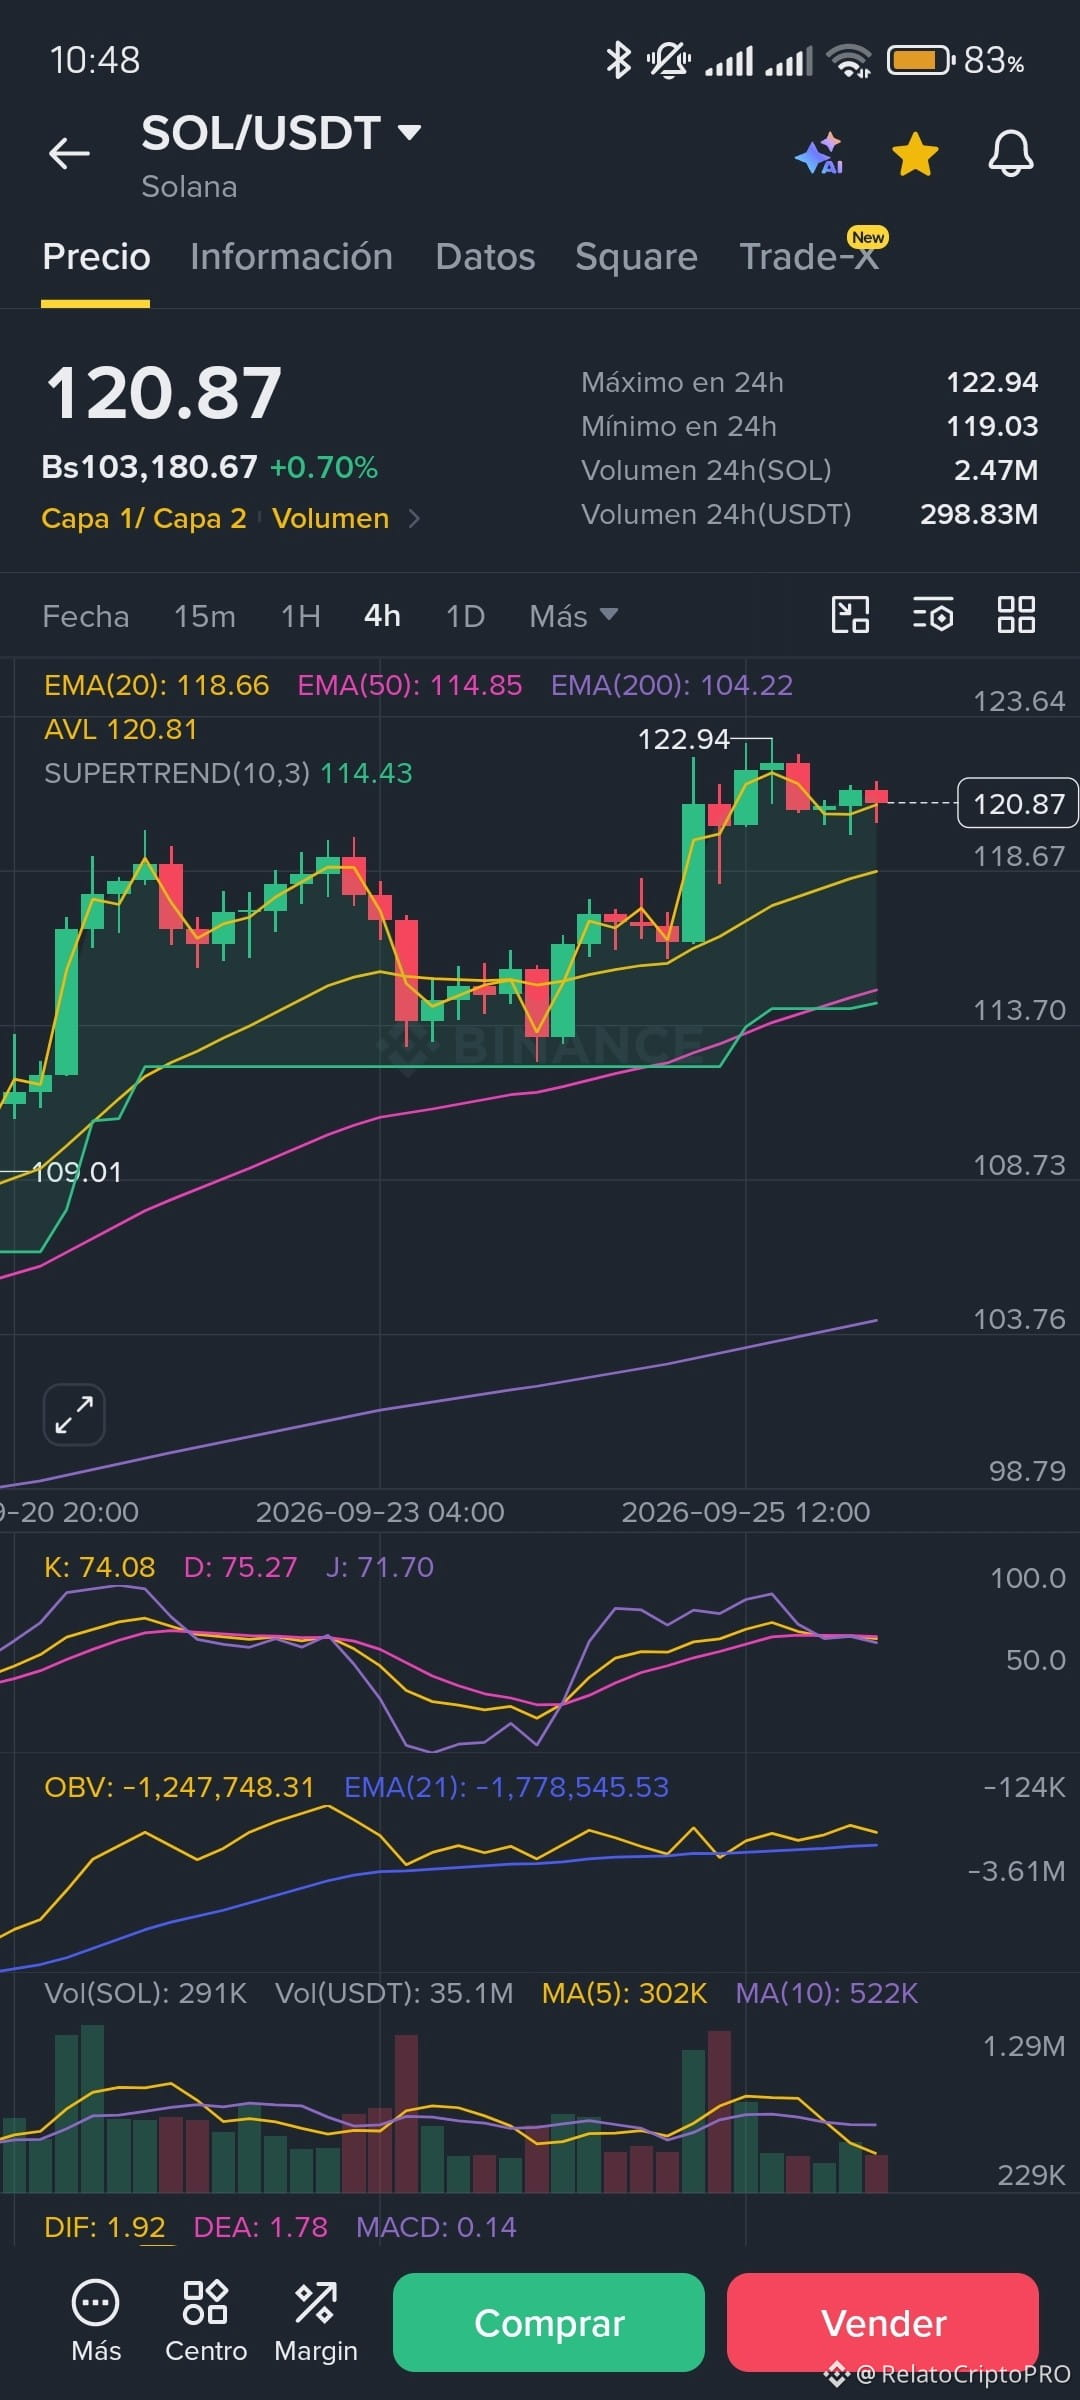
KDJ and MACD: Short-term directional exhaustion is clear. The 1H MACD prints a negative histogram of -0.17. In parallel, the 4H KDJ oscillator has stabilized neutrally, with the 'J' line at 71.70, losing the excess overbought momentum. The market is in a technical pause.
Volume Flow (OBV): There’s a slight intraday divergence. On the 1H timeframe, OBV fell below its 21-period moving average, indicating capital outflows in the short term, even though the broader 4H structure still keeps volume above the average.
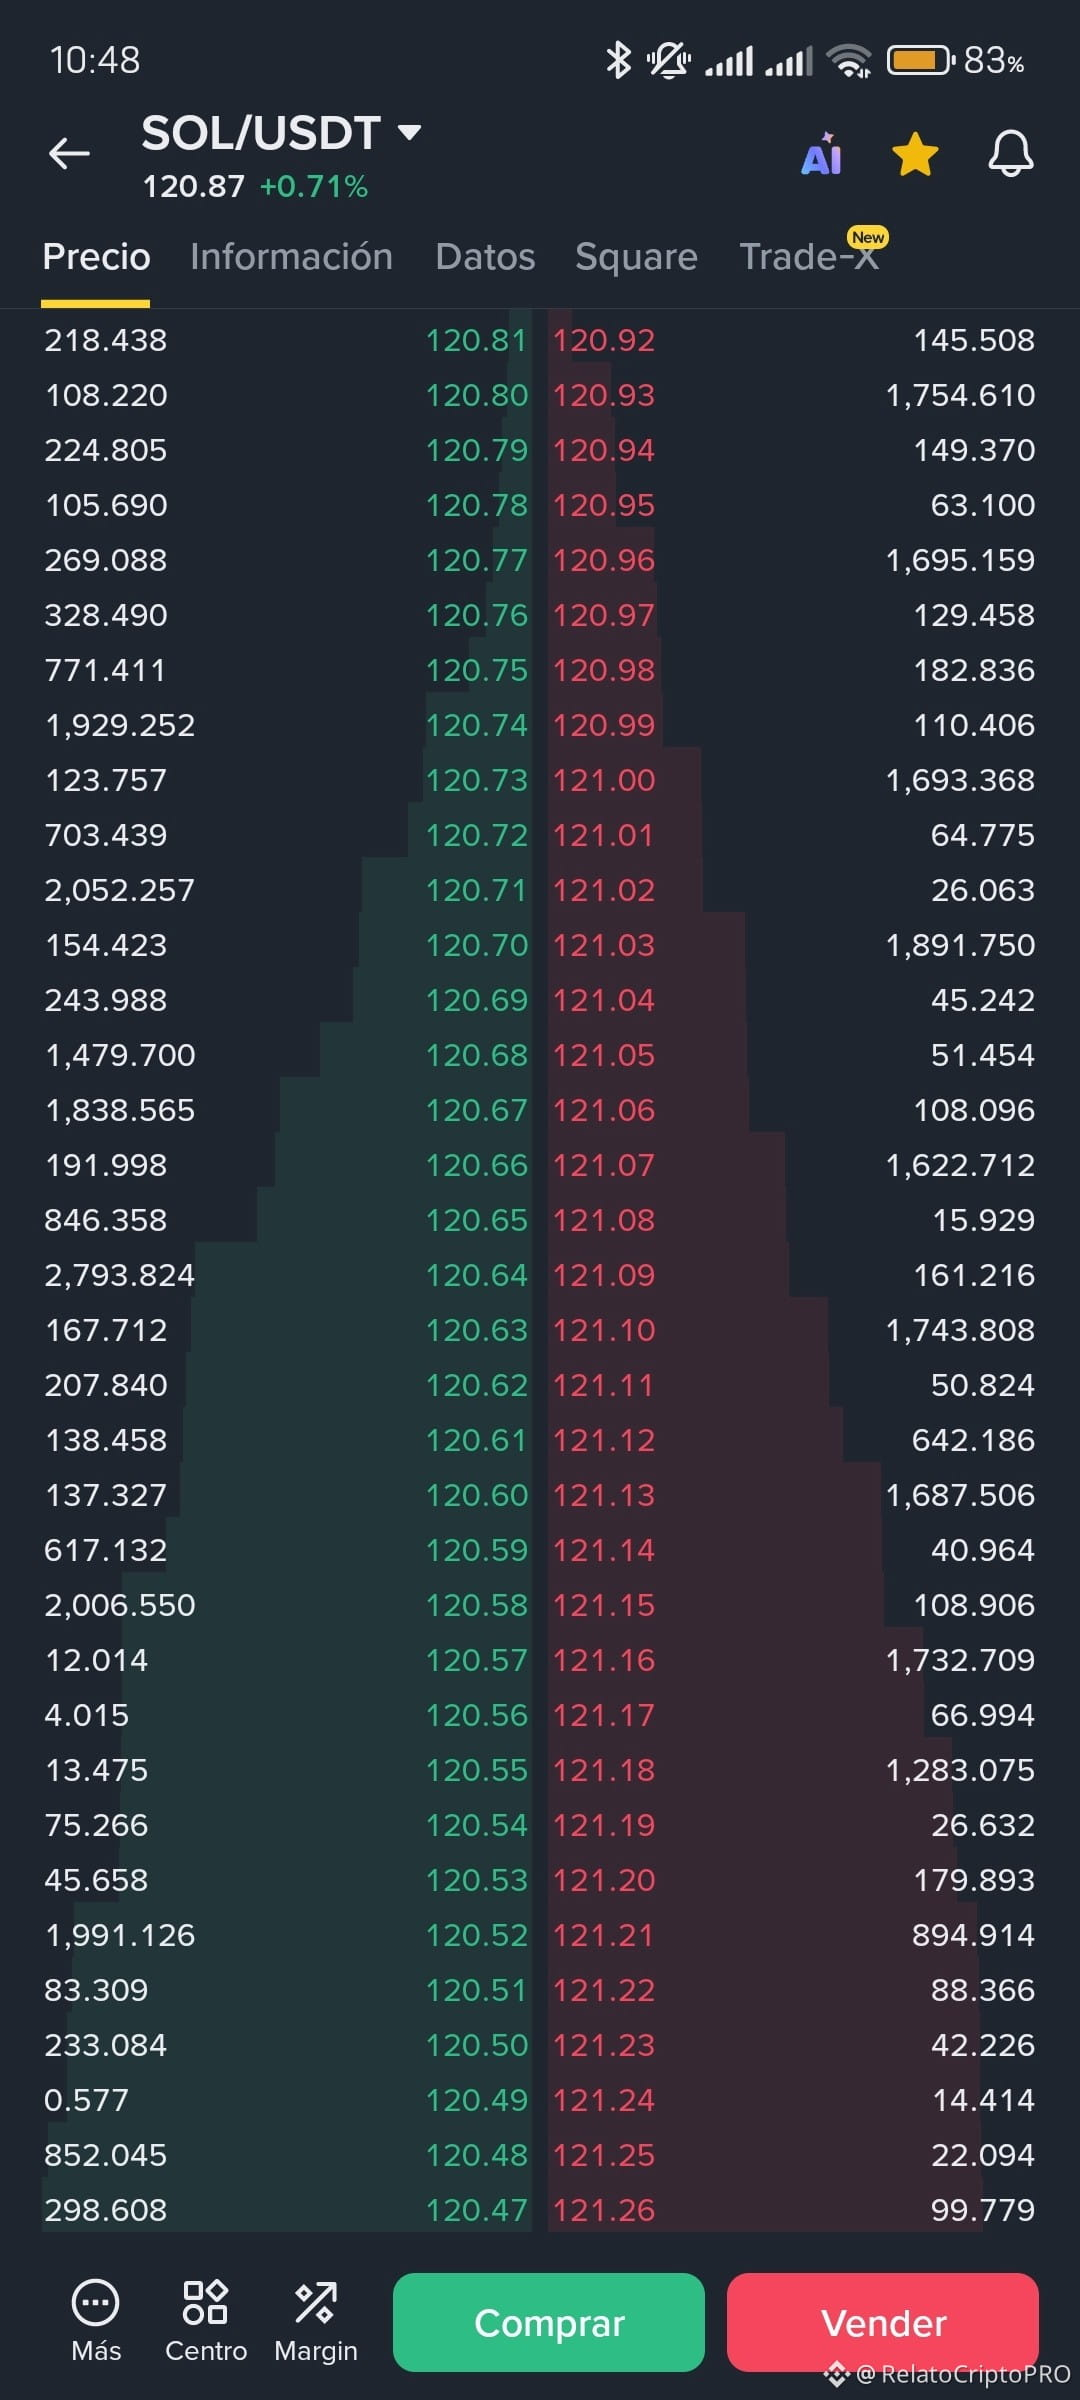
Order Book: The trenches confirm the paralysis. Below, buyers defend $120.64 with a 2,793 SOL block. Above, sellers have a hard, stepped ceiling, highlighting a 1,891 SOL barrier at $121.03.
Tactical Verdict:
Statistics demand discipline. Trading within this narrow channel is betting on noise. Bullish confirmation requires breaking the $120.97 AVL with real volume. Conversely, if the $120.64 buy wall gives way, the mathematical pullback will target the main safety net: the 4H 20 EMA at $118.66.
Patience—the algorithm will tell us when to act.
RelatoCripto PRO
Solana trades at $120.87, caught in a millimeter-tight compression. Let’s run every metric through the microscope to reveal where institutional pressure is pointing.
Indicators Audit:
Gravity and EMAs: The price is literally encapsulated. On the 1H chart, SOL struggles to break above the Volume-Weighted Average Price (AVL) of $120.97, but immediately finds dynamic support in the 20 EMA at $120.67. It’s a near-choking range of just 30 cents.
KDJ and MACD: Short-term directional exhaustion is clear. The 1H MACD prints a negative histogram of -0.17. In parallel, the 4H KDJ oscillator has stabilized neutrally, with the 'J' line at 71.70, losing the excess overbought momentum. The market is in a technical pause.
Volume Flow (OBV): There’s a slight intraday divergence. On the 1H timeframe, OBV fell below its 21-period moving average, indicating capital outflows in the short term, even though the broader 4H structure still keeps volume above the average.
Order Book: The trenches confirm the paralysis. Below, buyers defend $120.64 with a 2,793 SOL block. Above, sellers have a hard, stepped ceiling, highlighting a 1,891 SOL barrier at $121.03.
Tactical Verdict:
Statistics demand discipline. Trading within this narrow channel is betting on noise. Bullish confirmation requires breaking the $120.97 AVL with real volume. Conversely, if the $120.64 buy wall gives way, the mathematical pullback will target the main safety net: the 4H 20 EMA at $118.66.
Patience—the algorithm will tell us when to act.
RelatoCripto PRO