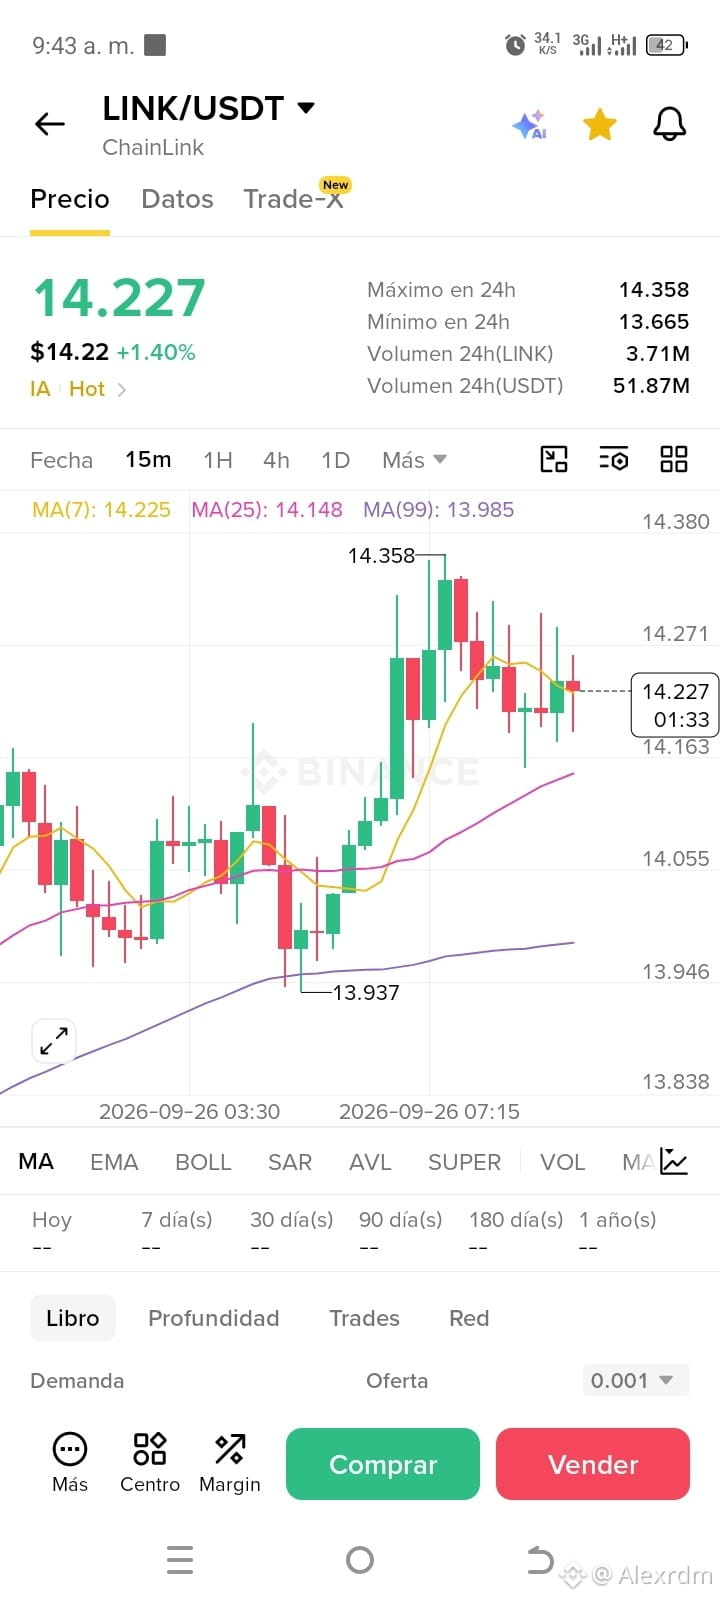
The chart for $LINK is trading at $14.227 (+1.40%), after reaching a recent high at $14.358 and bouncing cleanly from the $13.937 base.
The underlying bullish move has been strong (it boldly broke through the $13.40 and $13.50 area), but at the moment the 15m chart is showing a cooling phase and sideways movement at the top.
Technical Structure Analysis (15m)
Moving Average Alignment:
MA(7): $14.225 (price is sticking close to it).
MA(25): $14.148 (short-term dynamic support).
MA(99): $13.985 (the major institutional floor in the $14.00 area).
Rejection Wick Pattern: In the upper area between $14.27 and $14.35, several long upper wicks are visible. Sellers are taking profits at this barrier, preventing a fresh direct impulse for now.
Range Consolidation: After the move up from $13.93 to $14.35, price is compressing between $14.15 (MA25) and $14.30.
$NVDAB $BTC
The underlying bullish move has been strong (it boldly broke through the $13.40 and $13.50 area), but at the moment the 15m chart is showing a cooling phase and sideways movement at the top.
Technical Structure Analysis (15m)
Moving Average Alignment:
MA(7): $14.225 (price is sticking close to it).
MA(25): $14.148 (short-term dynamic support).
MA(99): $13.985 (the major institutional floor in the $14.00 area).
Rejection Wick Pattern: In the upper area between $14.27 and $14.35, several long upper wicks are visible. Sellers are taking profits at this barrier, preventing a fresh direct impulse for now.
Range Consolidation: After the move up from $13.93 to $14.35, price is compressing between $14.15 (MA25) and $14.30.
$NVDAB $BTC