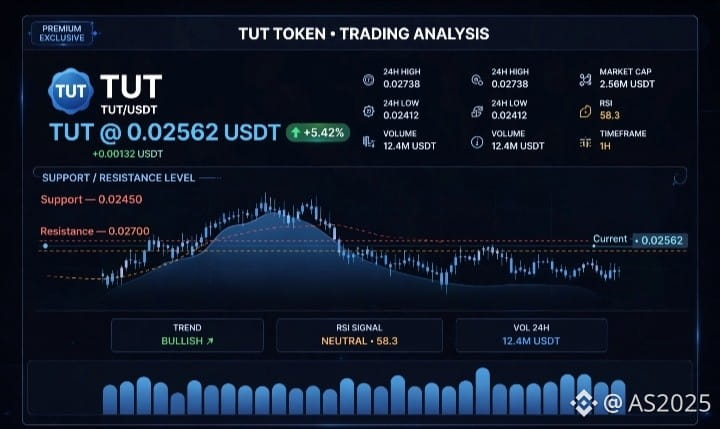
$TUT 0.02562$ rising +5.42% with volume 12.4M$ and RSI 58.3 above 0.02450$.. Is 0.02700$ the gate to 0.03000$? 🚀
1. *Previous high 0.02738$:* the chart made a higher high then dropped - now it’s re-accumulating
2. *SUPPORT 0.02450$:* the yellow line - the price is above it with a safe distance, and it bounced back at the end with rising candles
3. *RESISTANCE 0.02700$:* the red line above - this is the resistance that must be broken
4. *Current candles:* after a long drop, the small blue candles started to rise again around 0.02562$ + high volume at the end = buyers’ entry
- *Entry:* 0.02562$ current - above the support$TUT
- *Stop loss:*
- SL1: 0.02450$ support
- SL2: 0.02412$ if today
- *Targets:*
- *TP1:* 0.02700$ resistance
- *TP2:* 0.02738$ today’s high
- *TP3:* 0.02900$ after breaking 0.027
- *TP4:* 0.03000$ a psychological level
- *TP5:* 0.03250$ extended target
RSI 58.3 means there’s still room for upside before overbought.
1. *Previous high 0.02738$:* the chart made a higher high then dropped - now it’s re-accumulating
2. *SUPPORT 0.02450$:* the yellow line - the price is above it with a safe distance, and it bounced back at the end with rising candles
3. *RESISTANCE 0.02700$:* the red line above - this is the resistance that must be broken
4. *Current candles:* after a long drop, the small blue candles started to rise again around 0.02562$ + high volume at the end = buyers’ entry
- *Entry:* 0.02562$ current - above the support$TUT
- *Stop loss:*
- SL1: 0.02450$ support
- SL2: 0.02412$ if today
- *Targets:*
- *TP1:* 0.02700$ resistance
- *TP2:* 0.02738$ today’s high
- *TP3:* 0.02900$ after breaking 0.027
- *TP4:* 0.03000$ a psychological level
- *TP5:* 0.03250$ extended target
RSI 58.3 means there’s still room for upside before overbought.