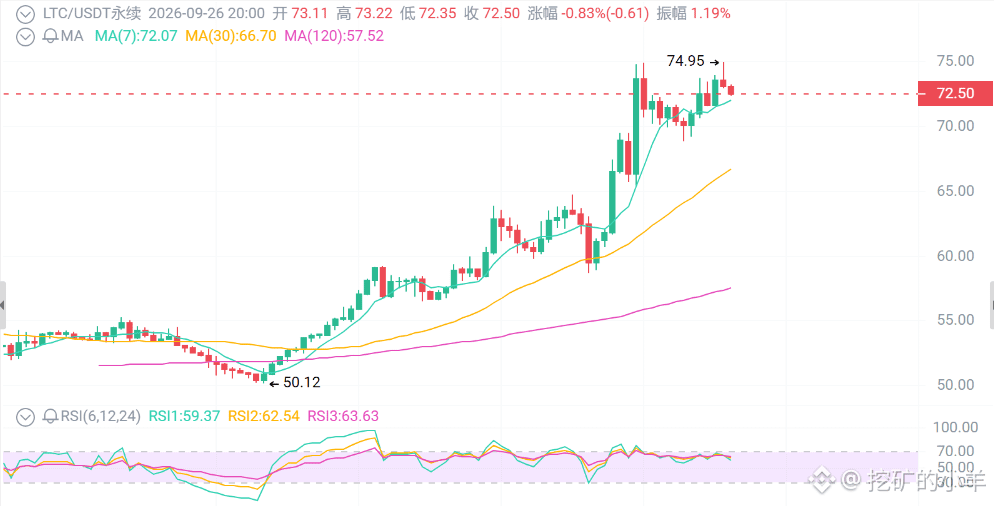
$72 LTC—are you going to chase it?
First, look at the surface: On September 24, LTC was violently pumped from 61, up more than 16% in a single day. Trading volume hit a new 2026 high and directly smashed through the top of the 50–62 range box.
Week-to-date gains are close to 30%. While BTC was moving sideways around $84,000, LTC carved out an independent move. The daily moving averages are in a bullish alignment: the 50-day MA has crossed above the 200-day MA, and a golden cross has already appeared.
First thing: ETFs and on-chain data—real money is buying.
The U.S. spot LTC ETF holdings hit a record of about 175,000 LTC. Canary added another 39,000 LTC in a single batch, and Grayscale is also pushing its trust to convert to an ETF. Even stronger on-chain—Litecoin Foundation reported that, after one day of adjustments, the daily economic transfer volume exceeded $1 billion, with about 17 million LTC in circulation.
This rally has fundamental support; it’s not just empty-air hype. But support doesn’t mean you can blindly chase.
Second thing: the halving is basically “known in advance,” but the obvious narratives are the easiest to exploit.
The next halving is expected in July 2027, when block rewards drop from 6.25 to 3.125—about 300 days from now. Historical pattern: halving narratives usually start to ferment 6–12 months ahead.
The halving move isn’t a straight line. It’s “pump a wave → wash a wave → pump another wave.” People who chase at the top always end up dying in that washout.
Third thing: derivatives are overheating, and leverage is piled up to dangerous levels.
Open interest in futures surged to about $670 million, near the 2026 high point—adding another $140 million in a short time. Funding rates are slightly positive, meaning longs are paying.
Daily RSI has entered overbought territory, with some readings above 80—momentum is overheated.
In the 72–75 range, upper wicks show up often, and volume fades after the pump—typical of “post-breakout lag.”
If 72–70 can’t be held, a retest to 67 is likely. Only if price can absorb and hold above 75 with volume, can you start to look toward 80.
Key resistance: 75–76 (needs volume and a firm hold to open room) → 80 → 84–85
Key support: 70–71 (short-term pullback zone) → 67–68 (break-confirmation zone) → 60–62
Trading strategy
Conservative longs:
Wait for a pullback to the 67–70 zone to stabilize. When you see long lower wicks or a low-volume sell-off stopping, try a small position to go long. Stop loss below 65 (or if the daily close breaks below 62). Target 75, and if it breaks through, watch for 80.
Aggressive breakout:
If it holds above 75 with strong volume, you can chase part of it. Stop loss 73. Target 80–84.
Short-term shorts / hedging:
Only suitable for ultra-short-term trading. Multiple attempts from 72–75 have repeatedly pumped and then rolled over, with momentum/volume shrinking. You can consider a light short with targets 70–68 and stop loss 75.5. Not recommended to go heavy—trend conditions have already turned bullish.
First, look at the surface: On September 24, LTC was violently pumped from 61, up more than 16% in a single day. Trading volume hit a new 2026 high and directly smashed through the top of the 50–62 range box.
Week-to-date gains are close to 30%. While BTC was moving sideways around $84,000, LTC carved out an independent move. The daily moving averages are in a bullish alignment: the 50-day MA has crossed above the 200-day MA, and a golden cross has already appeared.
First thing: ETFs and on-chain data—real money is buying.
The U.S. spot LTC ETF holdings hit a record of about 175,000 LTC. Canary added another 39,000 LTC in a single batch, and Grayscale is also pushing its trust to convert to an ETF. Even stronger on-chain—Litecoin Foundation reported that, after one day of adjustments, the daily economic transfer volume exceeded $1 billion, with about 17 million LTC in circulation.
This rally has fundamental support; it’s not just empty-air hype. But support doesn’t mean you can blindly chase.
Second thing: the halving is basically “known in advance,” but the obvious narratives are the easiest to exploit.
The next halving is expected in July 2027, when block rewards drop from 6.25 to 3.125—about 300 days from now. Historical pattern: halving narratives usually start to ferment 6–12 months ahead.
The halving move isn’t a straight line. It’s “pump a wave → wash a wave → pump another wave.” People who chase at the top always end up dying in that washout.
Third thing: derivatives are overheating, and leverage is piled up to dangerous levels.
Open interest in futures surged to about $670 million, near the 2026 high point—adding another $140 million in a short time. Funding rates are slightly positive, meaning longs are paying.
Daily RSI has entered overbought territory, with some readings above 80—momentum is overheated.
In the 72–75 range, upper wicks show up often, and volume fades after the pump—typical of “post-breakout lag.”
If 72–70 can’t be held, a retest to 67 is likely. Only if price can absorb and hold above 75 with volume, can you start to look toward 80.
Key resistance: 75–76 (needs volume and a firm hold to open room) → 80 → 84–85
Key support: 70–71 (short-term pullback zone) → 67–68 (break-confirmation zone) → 60–62
Trading strategy
Conservative longs:
Wait for a pullback to the 67–70 zone to stabilize. When you see long lower wicks or a low-volume sell-off stopping, try a small position to go long. Stop loss below 65 (or if the daily close breaks below 62). Target 75, and if it breaks through, watch for 80.
Aggressive breakout:
If it holds above 75 with strong volume, you can chase part of it. Stop loss 73. Target 80–84.
Short-term shorts / hedging:
Only suitable for ultra-short-term trading. Multiple attempts from 72–75 have repeatedly pumped and then rolled over, with momentum/volume shrinking. You can consider a light short with targets 70–68 and stop loss 75.5. Not recommended to go heavy—trend conditions have already turned bullish.