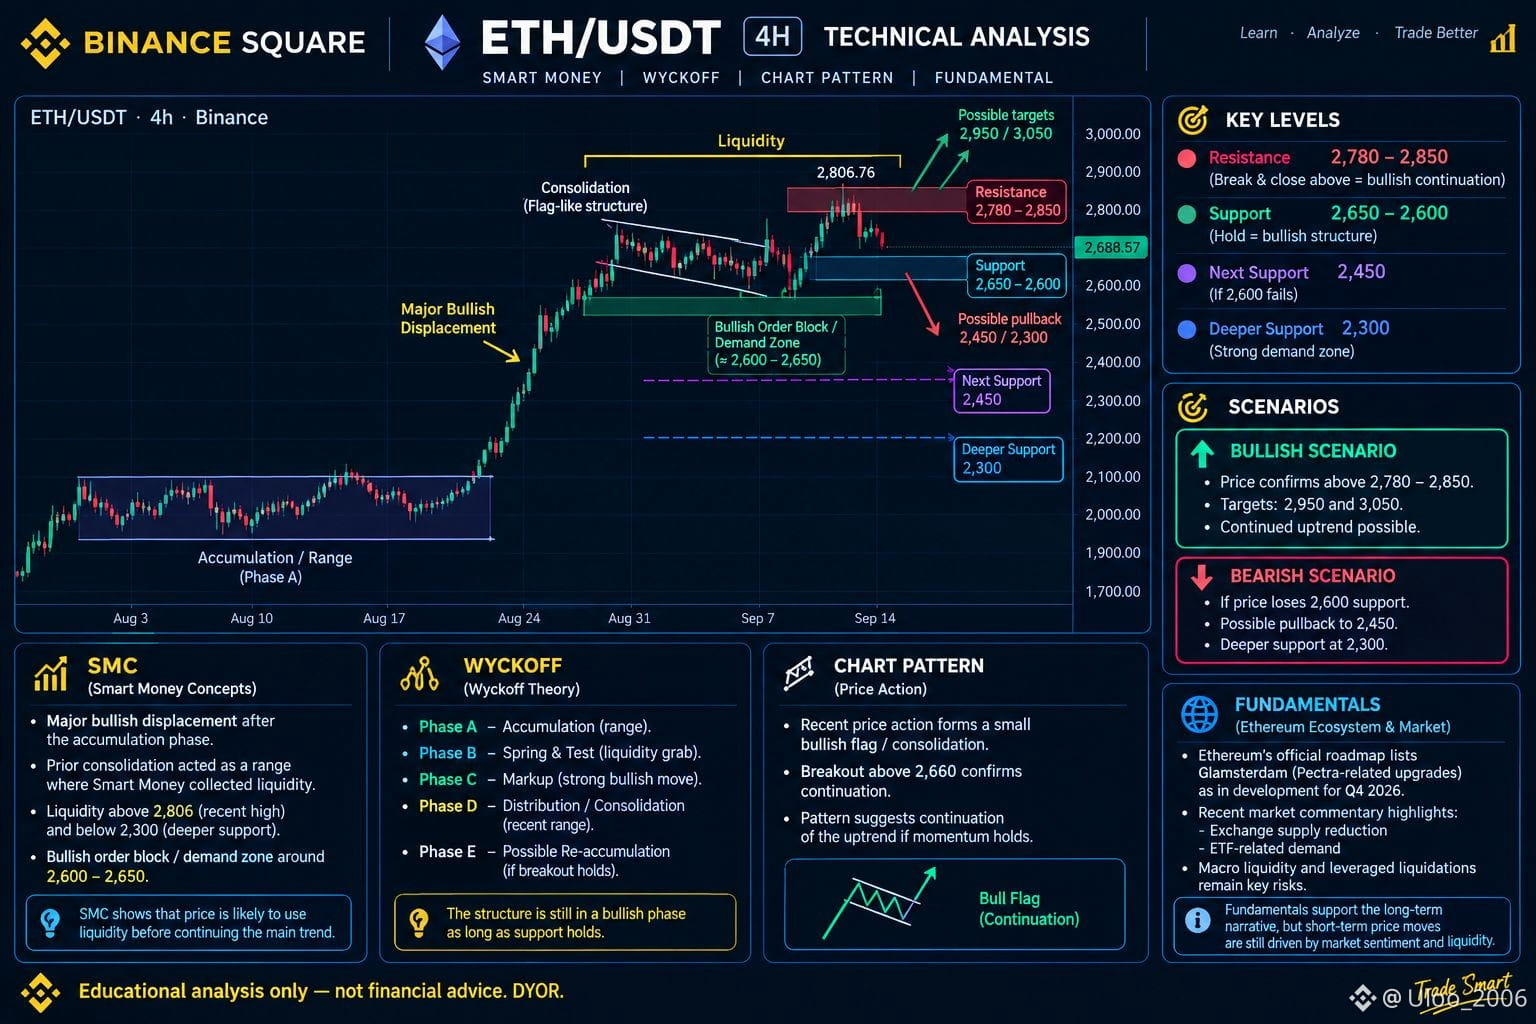
ETH/USDT 4H — SMC + Wyckoff + Chart Pattern + Fundamentals
Current Price: ~$2,688
Recent High: ~$2,806
🔹 SMC (Smart Money Concepts)
ETH made a strong bullish displacement from the previous accumulation area. The $2,600–$2,650 zone can be watched as a potential demand/order-block area.
The $2,780–$2,850 zone is the main liquidity and resistance area. A strong 4H close above this zone would be an important bullish confirmation.
🔹 Wyckoff Analysis
The previous sideways range can be interpreted as an accumulation phase, followed by a strong markup move. Current consolidation may represent re-accumulation, but confirmation is still required from future price action.
🔹 Chart Pattern
The recent structure resembles a bullish flag/consolidation pattern after a strong upward move.
Break & hold above $2,780–$2,850 → potential continuation
Rejection from resistance → possible pullback toward support
🔹 Fundamental Context
Ethereum's development roadmap remains an important long-term factor. However, short-term ETH price action can also be heavily affected by macro liquidity, ETF flows, Bitcoin direction and leveraged liquidations.
📍 Key Levels
Resistance: $2,780–$2,850
Support: $2,650–$2,600
Next Support: $2,450
Major Support: $2,300
🚀 Bullish Scenario
If ETH breaks and holds above $2,850, the next technical areas to monitor are approximately $2,950 and $3,050.
⚠️ Bearish Scenario
If ETH is rejected from resistance and loses $2,600, a deeper correction toward $2,450–$2,300 becomes technically possible.
Overall: The 4H structure remains constructive while the major support zone holds. The key confirmation is how ETH reacts around $2,780–$2,850.
Educational technical analysis only — not financial advice. DYOR and manage risk.
#ETH #Ethereum #ETHUSDT #BinanceSquare #CryptoTrading #TechnicalAnalysis #Crypto #Trading
$ETH
Current Price: ~$2,688
Recent High: ~$2,806
🔹 SMC (Smart Money Concepts)
ETH made a strong bullish displacement from the previous accumulation area. The $2,600–$2,650 zone can be watched as a potential demand/order-block area.
The $2,780–$2,850 zone is the main liquidity and resistance area. A strong 4H close above this zone would be an important bullish confirmation.
🔹 Wyckoff Analysis
The previous sideways range can be interpreted as an accumulation phase, followed by a strong markup move. Current consolidation may represent re-accumulation, but confirmation is still required from future price action.
🔹 Chart Pattern
The recent structure resembles a bullish flag/consolidation pattern after a strong upward move.
Break & hold above $2,780–$2,850 → potential continuation
Rejection from resistance → possible pullback toward support
🔹 Fundamental Context
Ethereum's development roadmap remains an important long-term factor. However, short-term ETH price action can also be heavily affected by macro liquidity, ETF flows, Bitcoin direction and leveraged liquidations.
📍 Key Levels
Resistance: $2,780–$2,850
Support: $2,650–$2,600
Next Support: $2,450
Major Support: $2,300
🚀 Bullish Scenario
If ETH breaks and holds above $2,850, the next technical areas to monitor are approximately $2,950 and $3,050.
⚠️ Bearish Scenario
If ETH is rejected from resistance and loses $2,600, a deeper correction toward $2,450–$2,300 becomes technically possible.
Overall: The 4H structure remains constructive while the major support zone holds. The key confirmation is how ETH reacts around $2,780–$2,850.
Educational technical analysis only — not financial advice. DYOR and manage risk.
#ETH #Ethereum #ETHUSDT #BinanceSquare #CryptoTrading #TechnicalAnalysis #Crypto #Trading
$ETH