🔥 Are Sharks Secretly Stockpiling Orders $QUSDT or Setting a Price-Increase Trap Waiting for Traders?
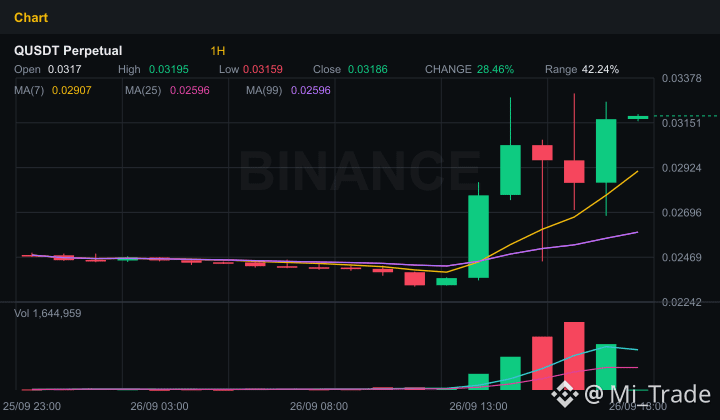
The crypto market always knows how to test traders’ patience, and the current $QUSDT chart is drawing an intensely curiosity-inducing picture. The M15 and H1 timeframes both agree on a bright green "bullish" signal—so is this a chance to turn things around, or a subtle trick?
Let’s break down the telling numbers from the market data to find the most accurate direction for $QUSDT:
- Trend & Momentum: RSI 14 is sitting right at the neutral 51.5 level, and MACD remains green, indicating buying pressure is still being quietly maintained with no sign of an overheated breakout.
- Trading Volume & Money Flow: Volume drops sharply by -49.8%, a signal that the bulls are temporarily running out of steam and are just observing. However, Open Interest jumps up 16.98% (to over 10 million USD), suggesting new positions are being opened in large numbers, waiting for a big move.
- Long/Short Battle: The global Long/Short ratio is fairly balanced (0.96), but the top traders’ "sharks" are holding up to 63.7% in Long positions (ratio 1.75). In addition, Taker Buy/Sell reaches 1.27, proving that active buying force still has the upper hand.
- Key Price Zones: Strong support is at 0.0232 and strong resistance is at 0.033. If the market breaks through this range, it will trigger a wide-range breakout.
So what’s the takeaway? Never FOMO based on emotions when volume is shrinking while Open Interest is heating up. Always set strict stop-loss orders right below the 0.0232 support zone to protect your account against any sudden liquidity sweeps from the market.
Are you holding a position with this coin, or are you standing by watching this potential trap unfold? Leave a comment below!
#QUSDT #BinanceSquare
The crypto market always knows how to test traders’ patience, and the current $QUSDT chart is drawing an intensely curiosity-inducing picture. The M15 and H1 timeframes both agree on a bright green "bullish" signal—so is this a chance to turn things around, or a subtle trick?
Let’s break down the telling numbers from the market data to find the most accurate direction for $QUSDT:
- Trend & Momentum: RSI 14 is sitting right at the neutral 51.5 level, and MACD remains green, indicating buying pressure is still being quietly maintained with no sign of an overheated breakout.
- Trading Volume & Money Flow: Volume drops sharply by -49.8%, a signal that the bulls are temporarily running out of steam and are just observing. However, Open Interest jumps up 16.98% (to over 10 million USD), suggesting new positions are being opened in large numbers, waiting for a big move.
- Long/Short Battle: The global Long/Short ratio is fairly balanced (0.96), but the top traders’ "sharks" are holding up to 63.7% in Long positions (ratio 1.75). In addition, Taker Buy/Sell reaches 1.27, proving that active buying force still has the upper hand.
- Key Price Zones: Strong support is at 0.0232 and strong resistance is at 0.033. If the market breaks through this range, it will trigger a wide-range breakout.
So what’s the takeaway? Never FOMO based on emotions when volume is shrinking while Open Interest is heating up. Always set strict stop-loss orders right below the 0.0232 support zone to protect your account against any sudden liquidity sweeps from the market.
Are you holding a position with this coin, or are you standing by watching this potential trap unfold? Leave a comment below!
#QUSDT #BinanceSquare