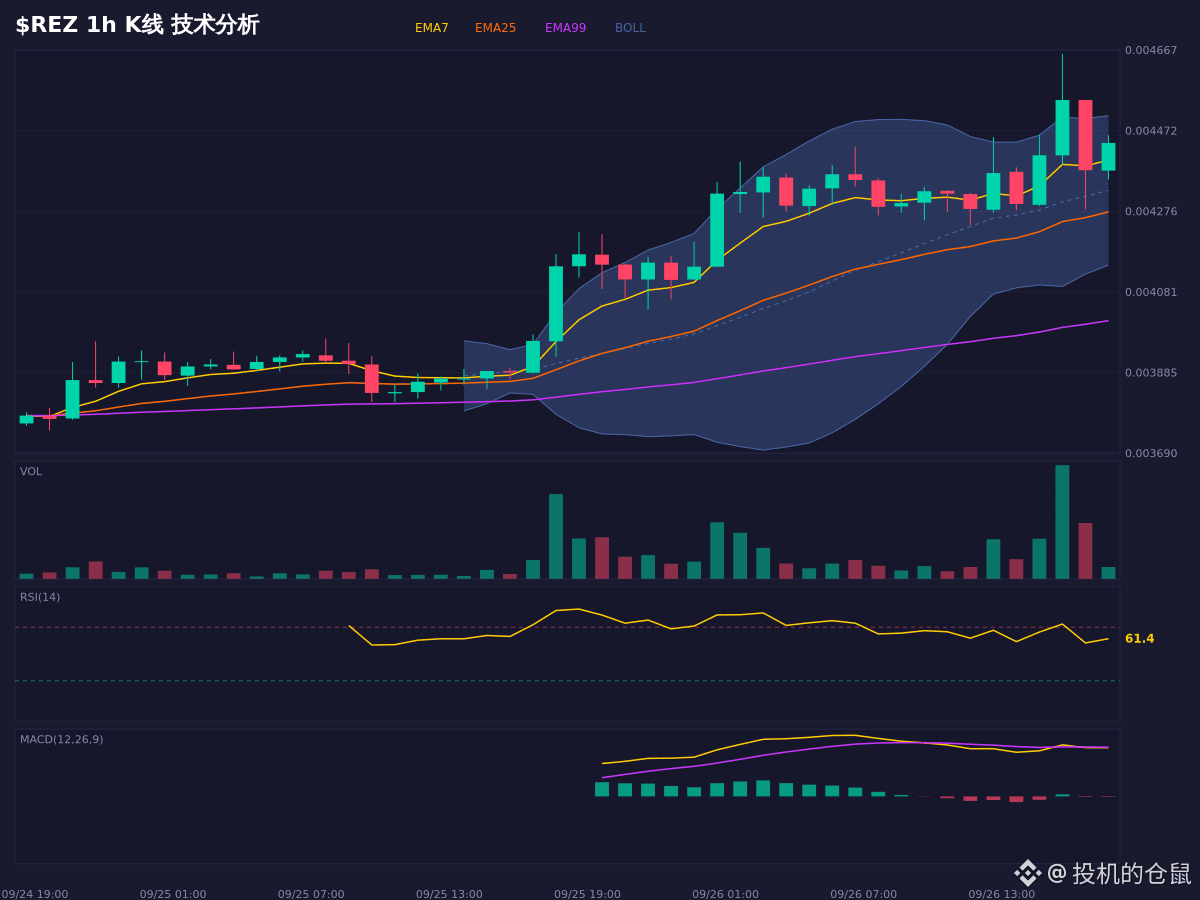
Current $REZ 0.004441, 24H amplitude 0.004038-0.004658, volume 21.53M USDT.
The most striking thing about this counter is the top bearish divergence! The price makes new highs, but the RSI doesn’t follow—there is a risk of a short-term pullback. Looking at the MACD and moving averages, they are also conflicting: the EMA7/25/99 bullish alignment clearly indicates an uptrend, but the MACD DIF<DEA and the bearish bars are expanding, with a clear volume-price divergence.
The Stoch RSI dead cross also points to a short-term correction. However, OBV shows capital inflow and the long/short ratio of 1.52 suggests bullish sentiment is still present.
If it holds the 0.004348-0.004421 range, the bullish structure may continue. If it breaks below 0.004213, the current logic fails.
Only for monitoring the chart and scenario analysis; it does not constitute a trading operation record.
$REZ #牛市 #市场情绪 #bear market
The most striking thing about this counter is the top bearish divergence! The price makes new highs, but the RSI doesn’t follow—there is a risk of a short-term pullback. Looking at the MACD and moving averages, they are also conflicting: the EMA7/25/99 bullish alignment clearly indicates an uptrend, but the MACD DIF<DEA and the bearish bars are expanding, with a clear volume-price divergence.
The Stoch RSI dead cross also points to a short-term correction. However, OBV shows capital inflow and the long/short ratio of 1.52 suggests bullish sentiment is still present.
If it holds the 0.004348-0.004421 range, the bullish structure may continue. If it breaks below 0.004213, the current logic fails.
Only for monitoring the chart and scenario analysis; it does not constitute a trading operation record.
$REZ #牛市 #市场情绪 #bear market