🔥 $TNSR Technical Breakthrough Warning: What Are the Bull Faction Trying to Pull Off? 🔥
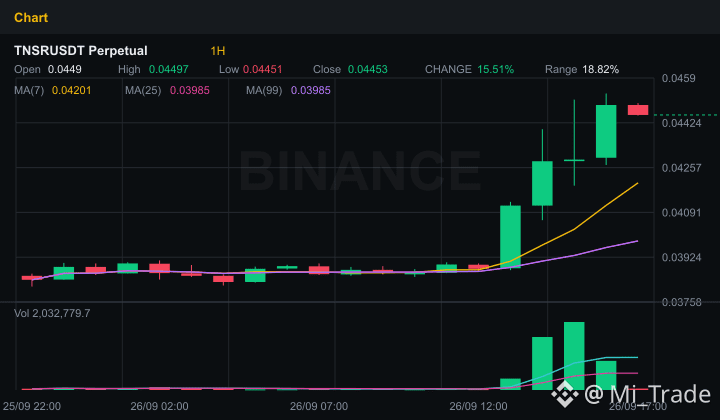
The crypto market is never short of those sudden “turnabouts” that leave traders scrambling. Looking at the chart $TNSR right now, do you feel your heart pounding faster? The M15 and H1 timeframes are both turning green in unison as prices rise—yet behind that “bullish” facade, what signals are the whales trying to hide? Let’s break it down now!
Technical Perspective & On-Chain Data:
• RSI(14) is surging to as high as 75.2—classic overbought territory. The bull camp is being extremely aggressive, pushing the price up, but beware: a “final sprint” could turn into exhaustion.
• MACD still supports the uptrend, but trading volume has dropped by as much as 57%. This is a major point to note: prices are rising while volume is lagging—conditions ripe for a “bull trap.”
• Open Interest (OI) unexpectedly jumped 6.16% within just the past hour, reaching over $3.6 million. Money is pouring into derivatives positions like crazy—leverage is being pumped hard.
• Crowd sentiment is extremely euphoric, with the global Long/Short ratio at 1.83 (64.7% Long). The top-trader “whales” also hold 60.3% of long positions.
• Key price levels you must pin down: Strong support at 0.03851, and the crucial resistance at 0.04533. If this resistance breaks, $TNSR could soar to unimaginable heights!
Trading Strategy & Risk Management:
With an overbought RSI combined with a sharp drop in volume, this is not the time to FOMO “all-in” regardless of everything. Take-profit pressure could hit at any moment to wipe out excessive Long positions. Always place your Stop Loss just below the 0.03851 support zone, and don’t use overly high leverage during this sensitive period, folks.
What do you think—will $TNSR break through resistance at 0.04533 to rocket higher, or will there be a liquidity shakeout drop before the next leg up? Leave your thoughts in the comments!
#TNSR #BinanceSquare
The crypto market is never short of those sudden “turnabouts” that leave traders scrambling. Looking at the chart $TNSR right now, do you feel your heart pounding faster? The M15 and H1 timeframes are both turning green in unison as prices rise—yet behind that “bullish” facade, what signals are the whales trying to hide? Let’s break it down now!
Technical Perspective & On-Chain Data:
• RSI(14) is surging to as high as 75.2—classic overbought territory. The bull camp is being extremely aggressive, pushing the price up, but beware: a “final sprint” could turn into exhaustion.
• MACD still supports the uptrend, but trading volume has dropped by as much as 57%. This is a major point to note: prices are rising while volume is lagging—conditions ripe for a “bull trap.”
• Open Interest (OI) unexpectedly jumped 6.16% within just the past hour, reaching over $3.6 million. Money is pouring into derivatives positions like crazy—leverage is being pumped hard.
• Crowd sentiment is extremely euphoric, with the global Long/Short ratio at 1.83 (64.7% Long). The top-trader “whales” also hold 60.3% of long positions.
• Key price levels you must pin down: Strong support at 0.03851, and the crucial resistance at 0.04533. If this resistance breaks, $TNSR could soar to unimaginable heights!
Trading Strategy & Risk Management:
With an overbought RSI combined with a sharp drop in volume, this is not the time to FOMO “all-in” regardless of everything. Take-profit pressure could hit at any moment to wipe out excessive Long positions. Always place your Stop Loss just below the 0.03851 support zone, and don’t use overly high leverage during this sensitive period, folks.
What do you think—will $TNSR break through resistance at 0.04533 to rocket higher, or will there be a liquidity shakeout drop before the next leg up? Leave your thoughts in the comments!
#TNSR #BinanceSquare