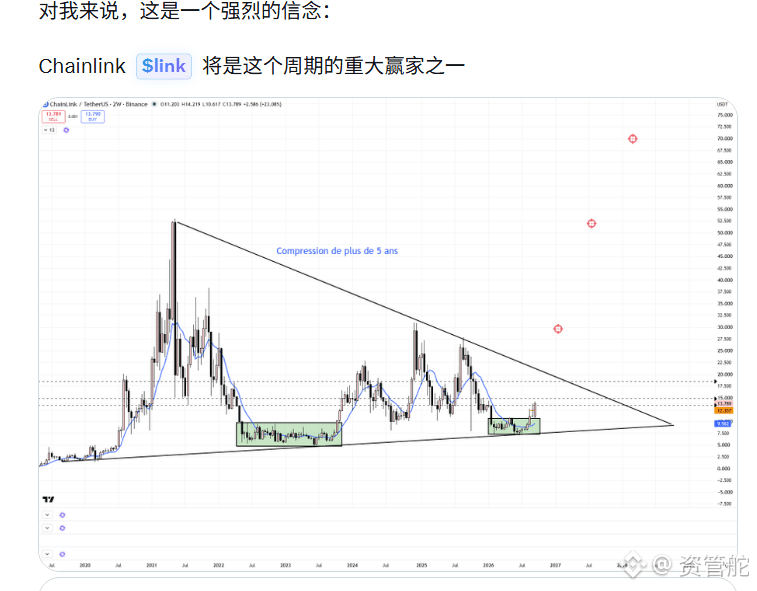
An analyst posts a two-year chart of Chainlink, marking a compression triangle with a span of more than five years. The caption reflects his strong conviction: LINK will be one of the major winners of this cycle. The compressed pattern suggests that both bulls and bears keep probing back and forth within an increasingly narrow range—direction will eventually be chosen, but whether it’s up or down, the chart doesn’t provide the answer. The green box he draws is the accumulation zone in the past, while the dashed line segment on the right leaves room for speculation. A chart can hold beliefs, but it can’t replace judgment. You can look at someone else’s chart, but you still have to decide your position yourself.


Post

--
Disclaimer: Includes third-party opinions. No advice. Binance AI may be used without guarantee. See T&Cs.