SOL looks weak, but the bigger picture tells a different story.
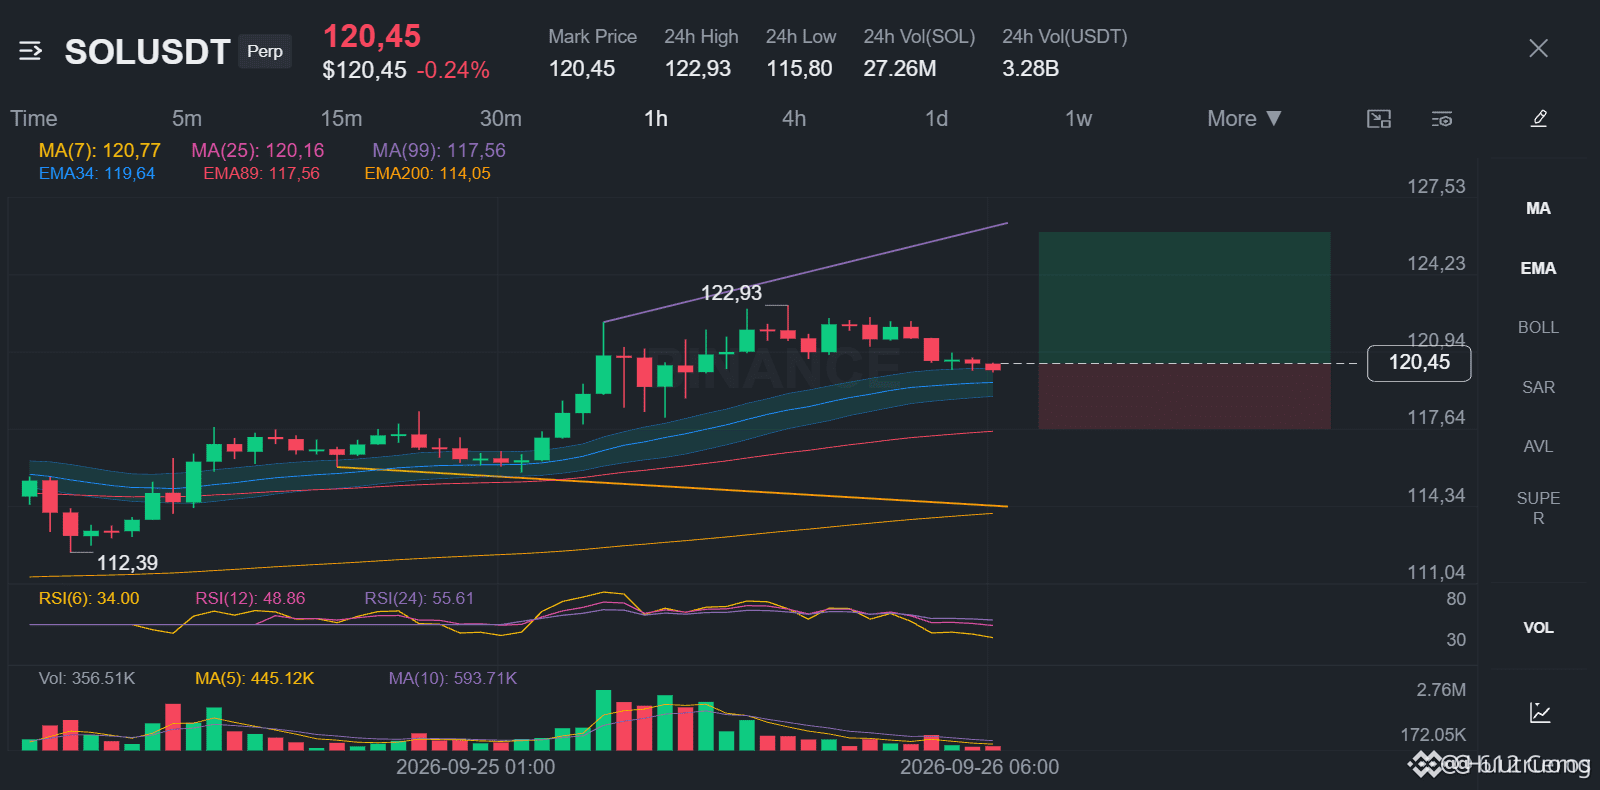
📊 $SOL /USDT · Trend: LONG (Bias) · 5/12 consensus signals
⚠️ This is a biased (lean) trade setup, not a high-confidence setup: there is still 1 opposing signal. Consider a position size that fits the risk.
Technical conclusion: BIAS TOWARD LONG. 5 out of 12 signals agree, 1 is against.
Supporting points (5):
• D1 timeframe trend: price > EMA50 > EMA200, bullish order stacking (bullish stack)
• 4h timeframe trend: price > EMA50 > EMA200, bullish order stacking
• 1h timeframe trend: price > EMA50 > EMA200, bullish order stacking
• 4h RSI: 61.8, bullish momentum (above 55)
Opposing points (1):
• Trend strength (ADX/DI, 15m): ADX 25.8 suggests the selling side is controlling (DI+ 15.2 vs DI− 24.8)
Where the levels are:
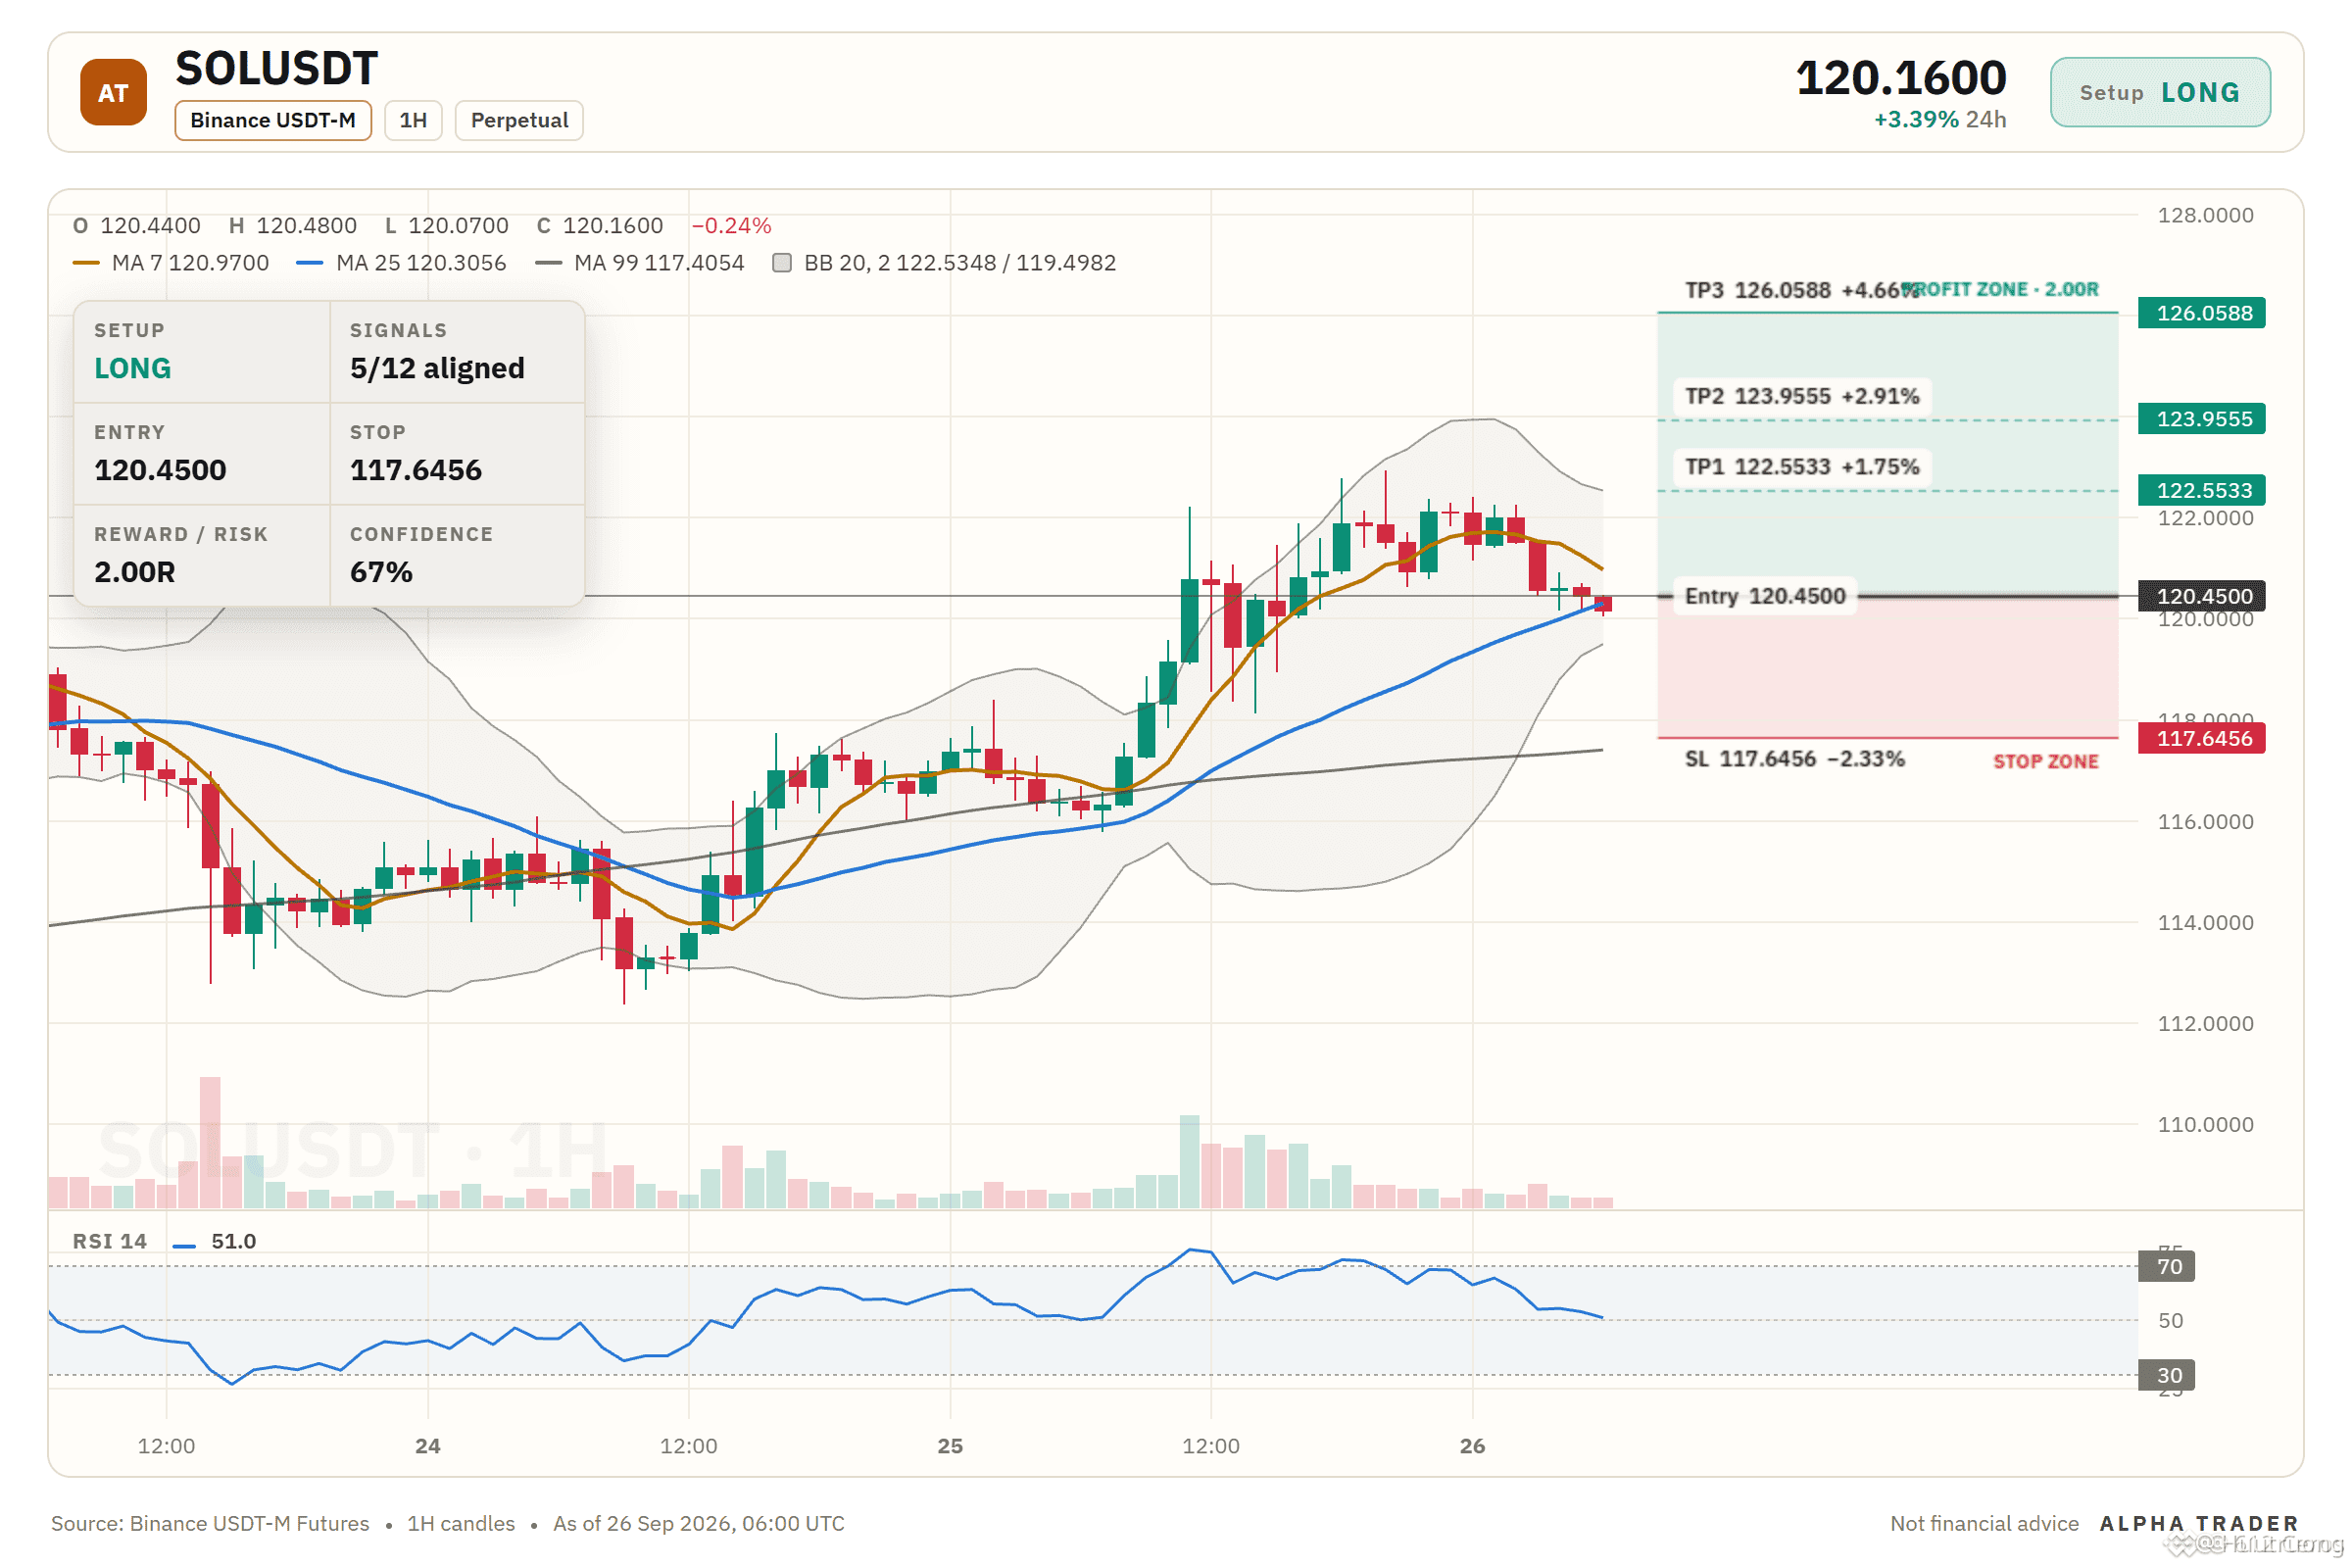
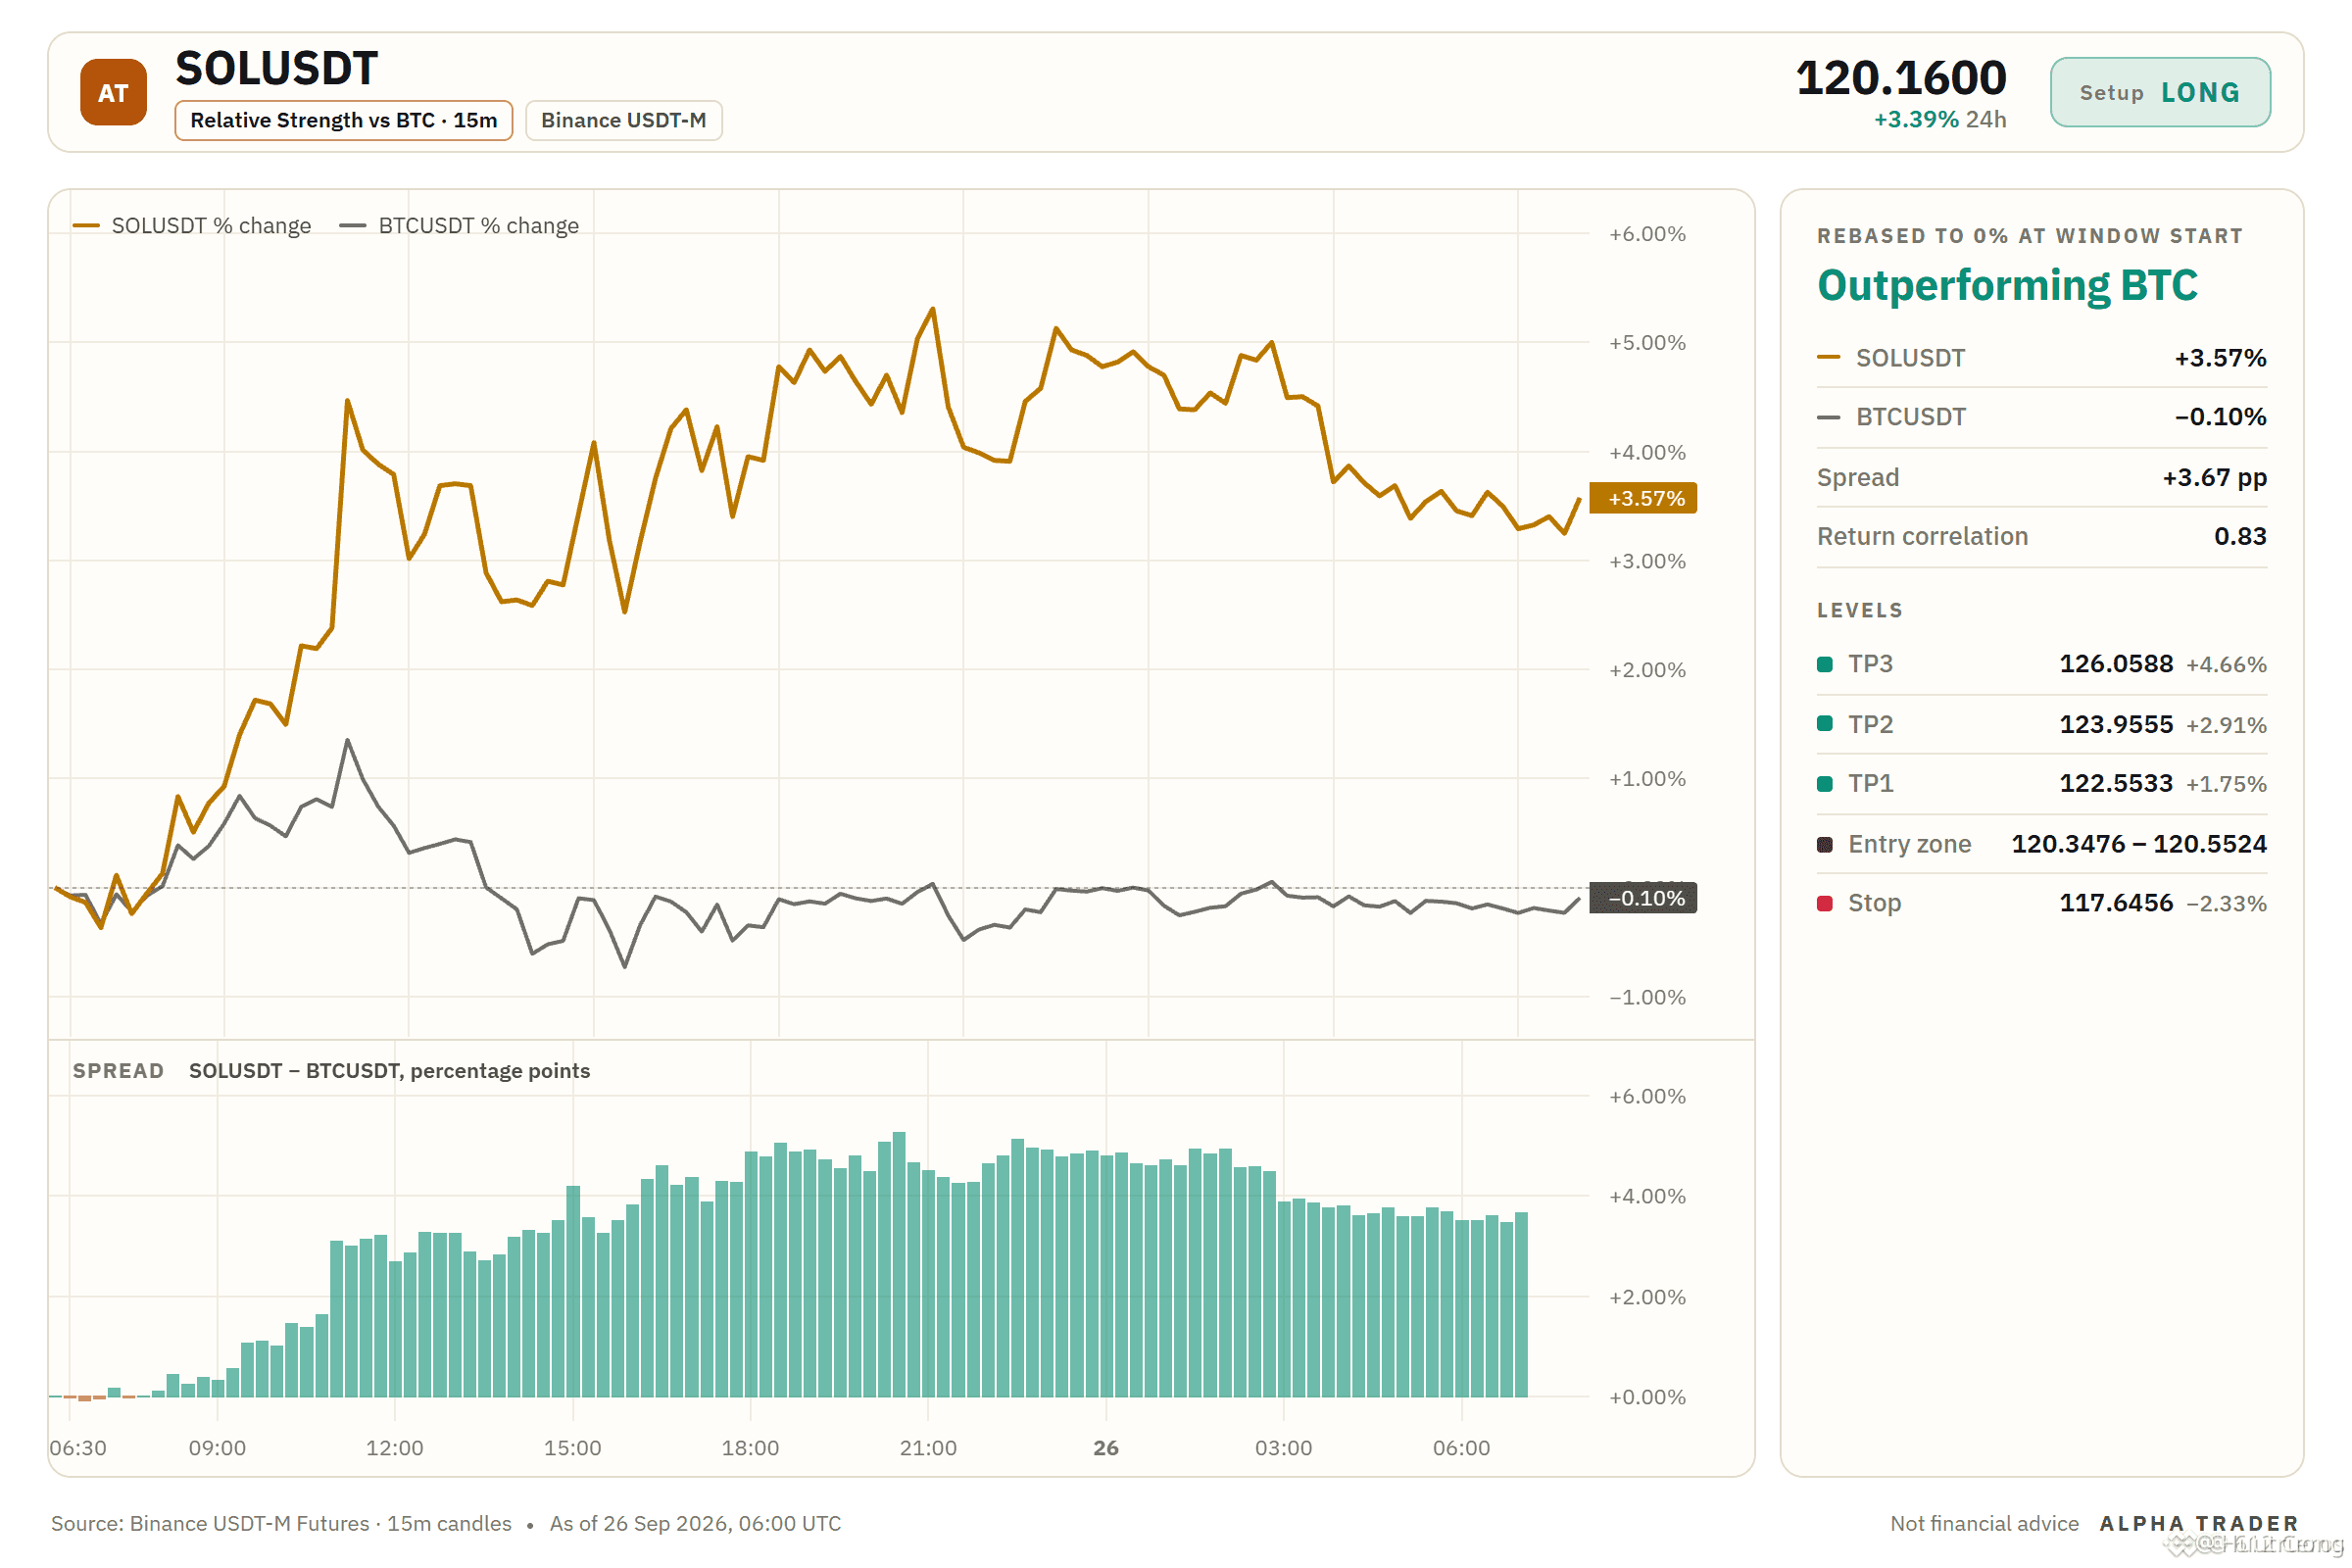
🎯 TP3: 126.0588
🎯 TP2: 123.9555
🎯 TP1: 122.5533
📍 Entry: 120.3476 – 120.5524
🛑 Stop loss (SL): 117.6456
🟢 Bullish scenario:
From 120.45, the 1h timeframe price could push up toward TP1 at 122.5533 and then TP2 at 123.9555, supported by the uptrend on the D1 timeframe still being maintained. The 4h timeframe trend is bullish, and the 4h RSI is at 61.8, confirming the bullish momentum. Confidence is medium because there are some elements that don’t align, including the 15m ADX indicating the sell side is controlling at 24.8 versus DI+ at 15.2.
🛑 What kills this trade:
If price breaks down below the SL at 117.6456, the thesis is invalidated. And if a D1 closing candle occurs below the invalidation level at 112.7819, I will be forced to exit the trade and reassess.
💬 If you’re taking this short setup, what level would you use as the invalidation threshold?
The marked levels are shown on the chart below 👇
📊 $SOL /USDT · Trend: LONG (Bias) · 5/12 consensus signals
⚠️ This is a biased (lean) trade setup, not a high-confidence setup: there is still 1 opposing signal. Consider a position size that fits the risk.
Technical conclusion: BIAS TOWARD LONG. 5 out of 12 signals agree, 1 is against.
Supporting points (5):
• D1 timeframe trend: price > EMA50 > EMA200, bullish order stacking (bullish stack)
• 4h timeframe trend: price > EMA50 > EMA200, bullish order stacking
• 1h timeframe trend: price > EMA50 > EMA200, bullish order stacking
• 4h RSI: 61.8, bullish momentum (above 55)
Opposing points (1):
• Trend strength (ADX/DI, 15m): ADX 25.8 suggests the selling side is controlling (DI+ 15.2 vs DI− 24.8)
Where the levels are:
🎯 TP3: 126.0588
🎯 TP2: 123.9555
🎯 TP1: 122.5533
📍 Entry: 120.3476 – 120.5524
🛑 Stop loss (SL): 117.6456
🟢 Bullish scenario:
From 120.45, the 1h timeframe price could push up toward TP1 at 122.5533 and then TP2 at 123.9555, supported by the uptrend on the D1 timeframe still being maintained. The 4h timeframe trend is bullish, and the 4h RSI is at 61.8, confirming the bullish momentum. Confidence is medium because there are some elements that don’t align, including the 15m ADX indicating the sell side is controlling at 24.8 versus DI+ at 15.2.
🛑 What kills this trade:
If price breaks down below the SL at 117.6456, the thesis is invalidated. And if a D1 closing candle occurs below the invalidation level at 112.7819, I will be forced to exit the trade and reassess.
💬 If you’re taking this short setup, what level would you use as the invalidation threshold?
The marked levels are shown on the chart below 👇