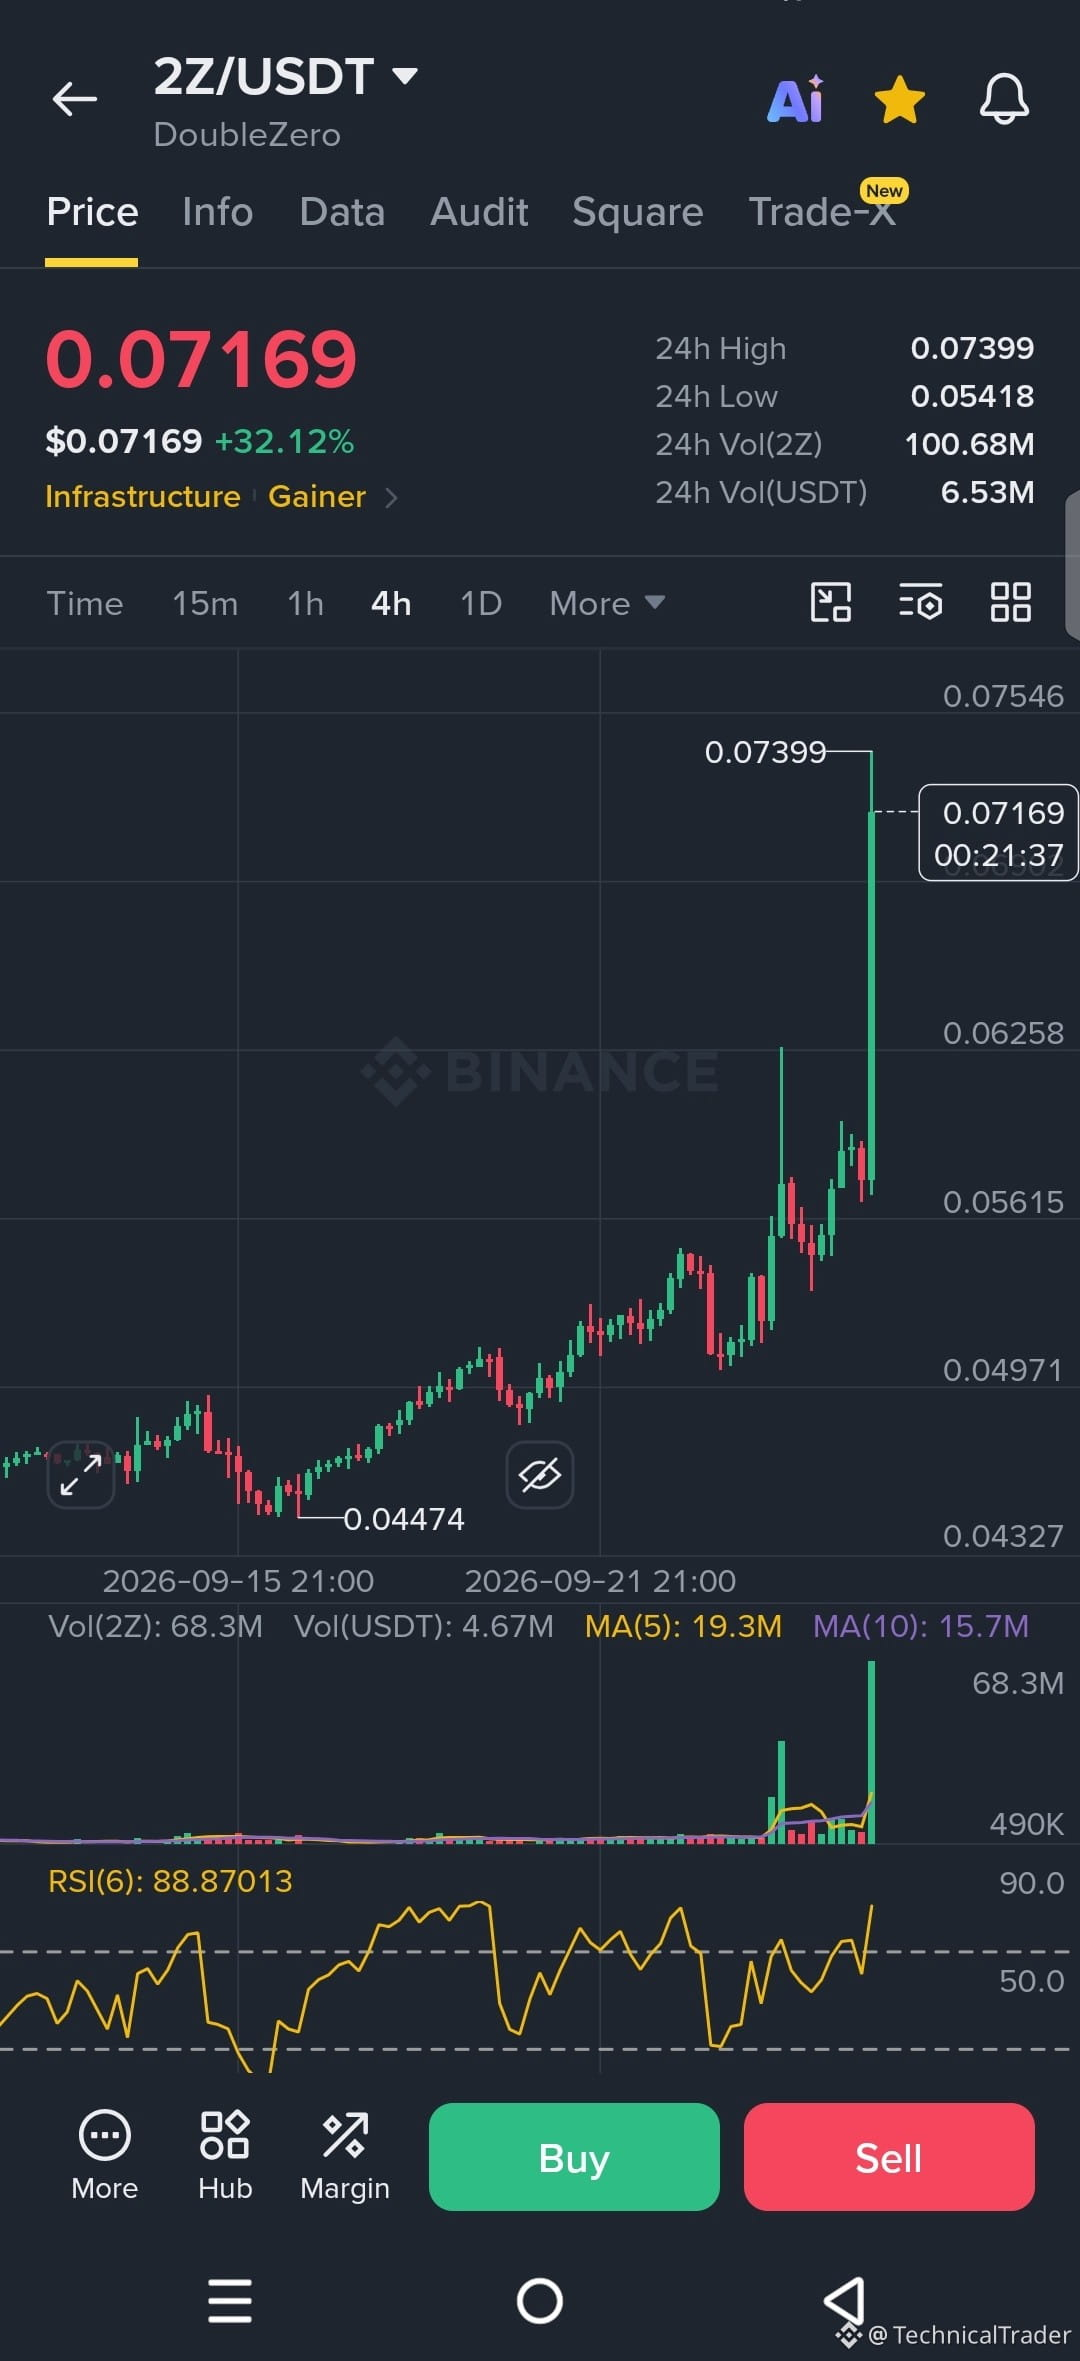
Guys, the price of $2Z pushed all the way up to 0.07399, which is the clear recent high on this 4H chart. This is the level I’m watching most closely. 👀
The structure is strongly bullish, with price continuing to print higher highs and higher lows. The latest move also came with a big volume spike, showing strong participation behind the breakout.
But here’s the interesting part: RSI is around 88.87, so momentum is extremely strong but also heavily stretched. That doesn’t automatically mean a reversal, but it does make the reaction around 0.07399 very important.
If $2Z breaks and holds above 0.07399, that would show buyers are still in control and could open the way for price discovery above the visible chart range. 📈⚡️
On the other hand, rejection from 0.07399 could bring price back toward the previous reaction area around 0.06258. If selling becomes stronger, 0.05615 is another important visible level to watch.
Right now, I’m mainly watching how the 4H candles react around 0.07399. A strong rejection would support the bearish scenario, while a clean break and hold above it would strengthen the bullish continuation. A move back below 0.06258 would weaken the current bullish structure.
Guys, follow for more chart analysis 😎 I’ll keep showing you exactly what the chart is telling us. 👀🔥
The structure is strongly bullish, with price continuing to print higher highs and higher lows. The latest move also came with a big volume spike, showing strong participation behind the breakout.
But here’s the interesting part: RSI is around 88.87, so momentum is extremely strong but also heavily stretched. That doesn’t automatically mean a reversal, but it does make the reaction around 0.07399 very important.
If $2Z breaks and holds above 0.07399, that would show buyers are still in control and could open the way for price discovery above the visible chart range. 📈⚡️
On the other hand, rejection from 0.07399 could bring price back toward the previous reaction area around 0.06258. If selling becomes stronger, 0.05615 is another important visible level to watch.
Right now, I’m mainly watching how the 4H candles react around 0.07399. A strong rejection would support the bearish scenario, while a clean break and hold above it would strengthen the bullish continuation. A move back below 0.06258 would weaken the current bullish structure.
Guys, follow for more chart analysis 😎 I’ll keep showing you exactly what the chart is telling us. 👀🔥